GLI sea surface temperature anomaly (2003)
March (19-22 mean)
A2GL1030319_GMAAV4_ANO1T3.GIF - 57,368BYTES
July monthly
A2GL1030701_GMAAVM_ano2T3T.GIF - 39,826BYTES

April (02-30 mean)
A2GL1030402_GMAAVM_ano2T3T.GIF - 42,226BYTES

August monthly
A2GL1030801_GMAAVM_ano2T3T.GIF - 41,974BYTES
May monthly
A2GL1030501_GMAAVM_ano2T3T.GIF - 39,530BYTES
September monthly
A2GL1030901_GMAAVM_ANO2T3.GIF - 50,849BYTES
June monthly
A2GL1030601_GMAAVM_ano2T3T.GIF - 38,100BYTES
October monthly
A2GL1031001_GMAAVM_ANO2T3.GIF - 50,703BYTES

Observational Date: 2003/03/19-2003/10/24
Global monthly sea surface temperature anomaly images
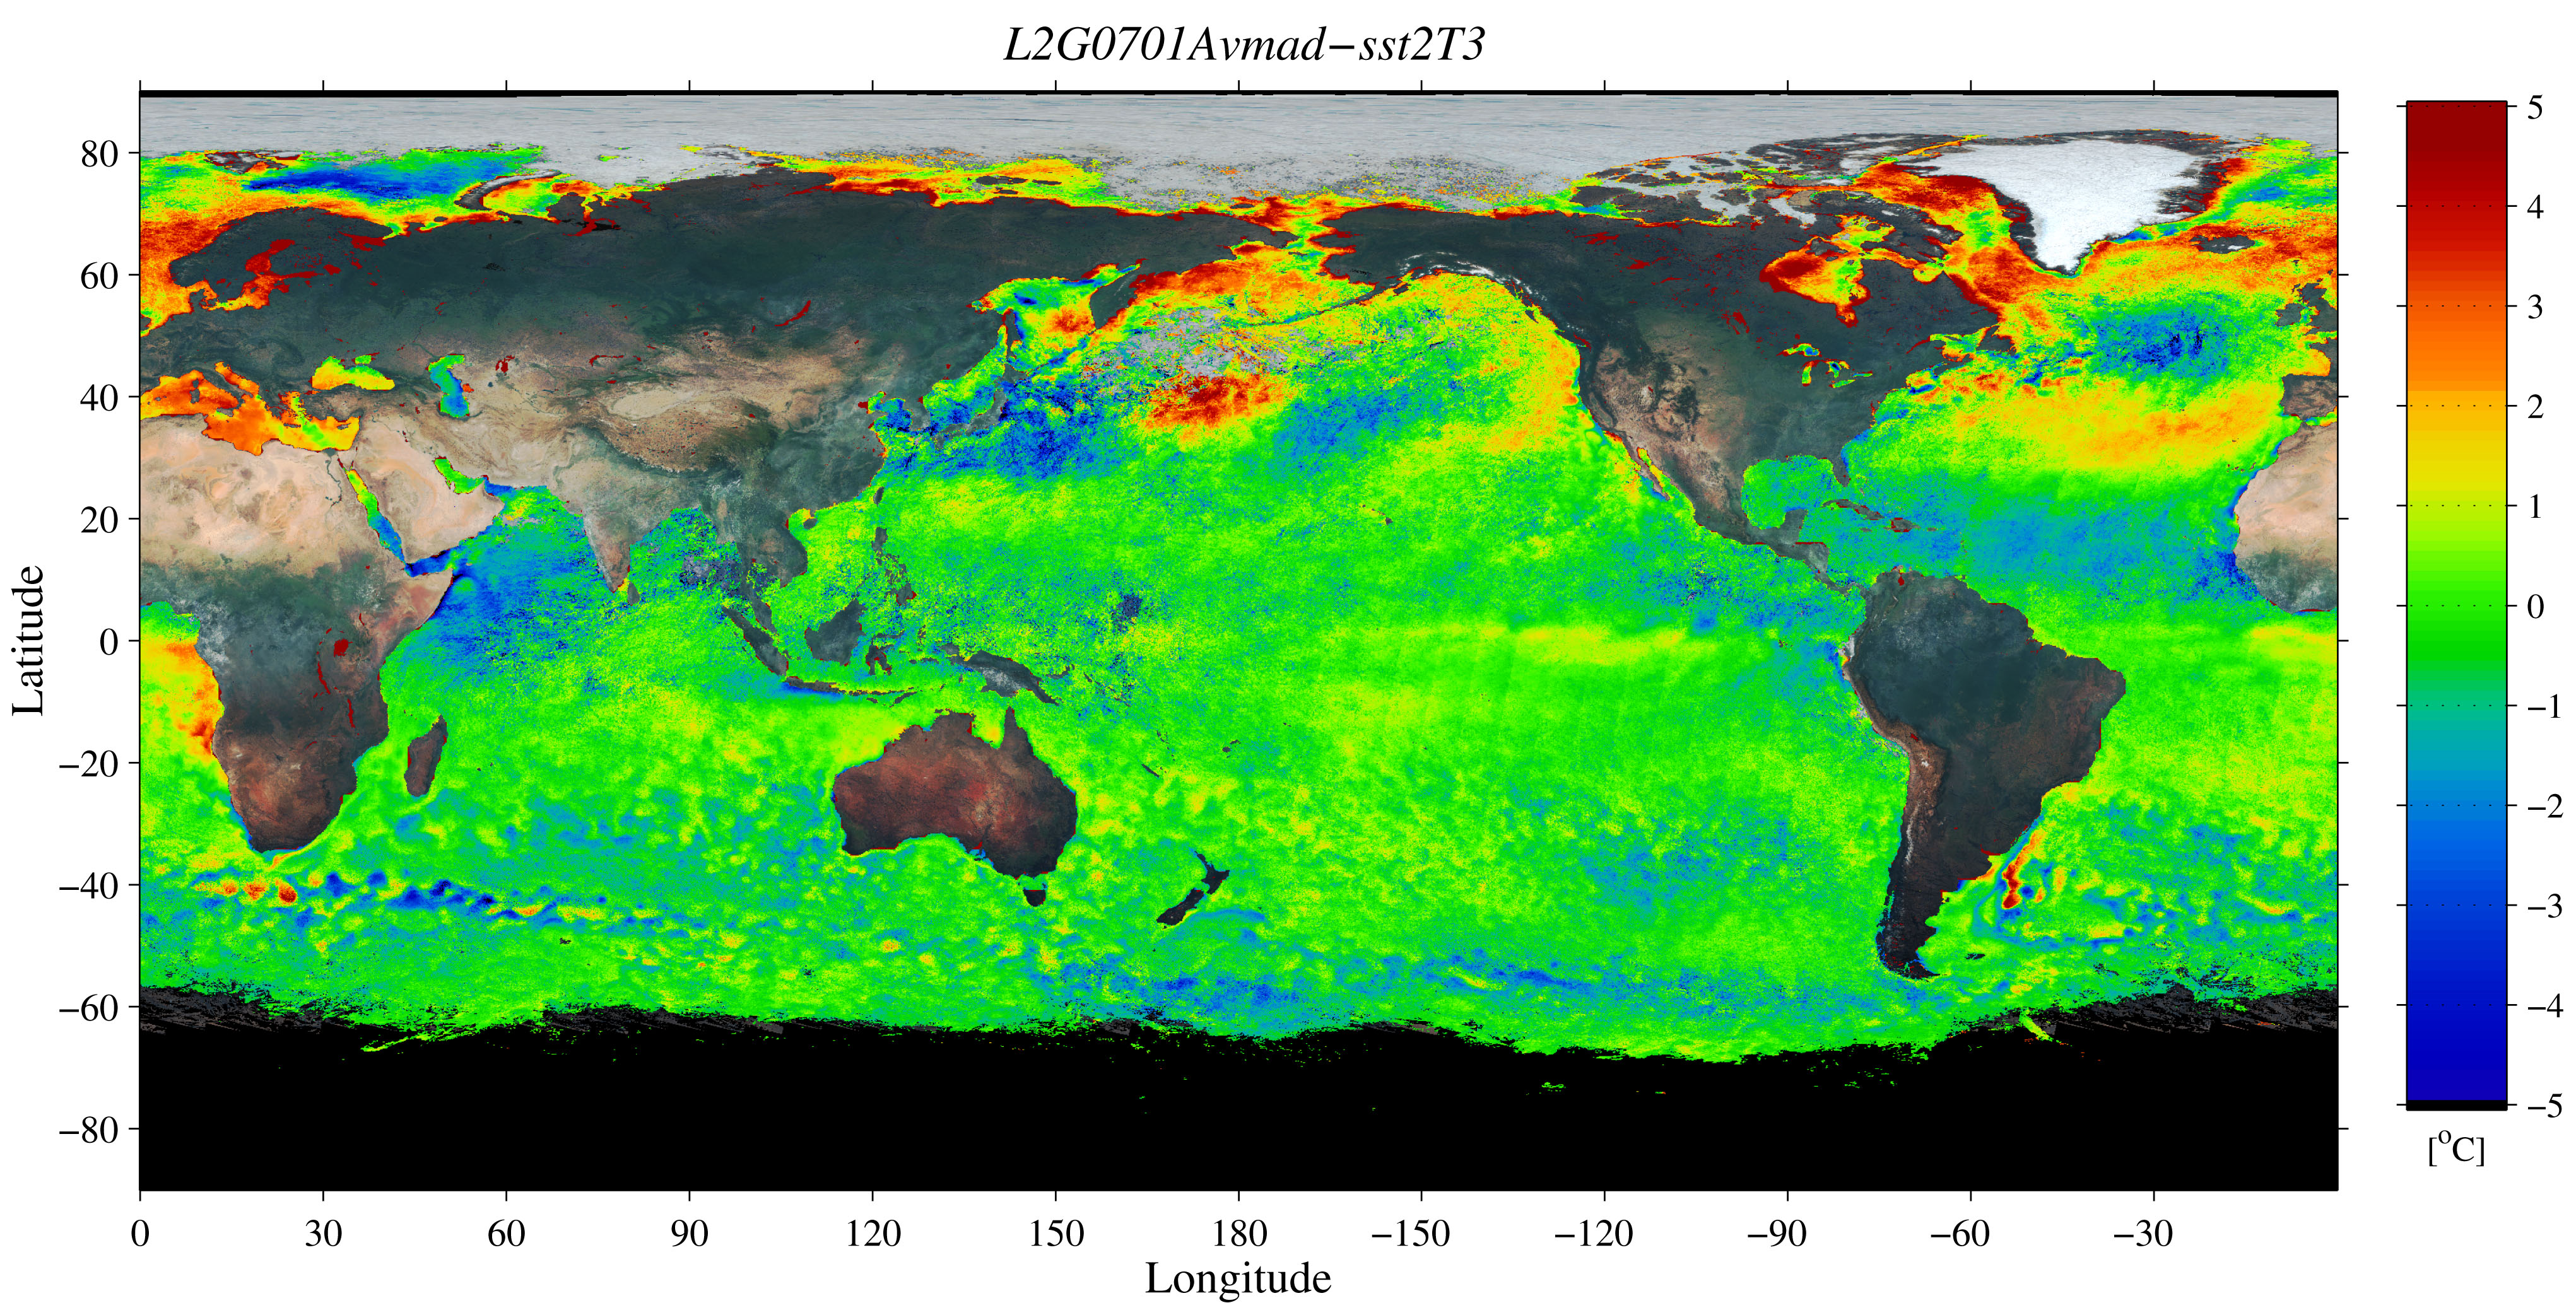
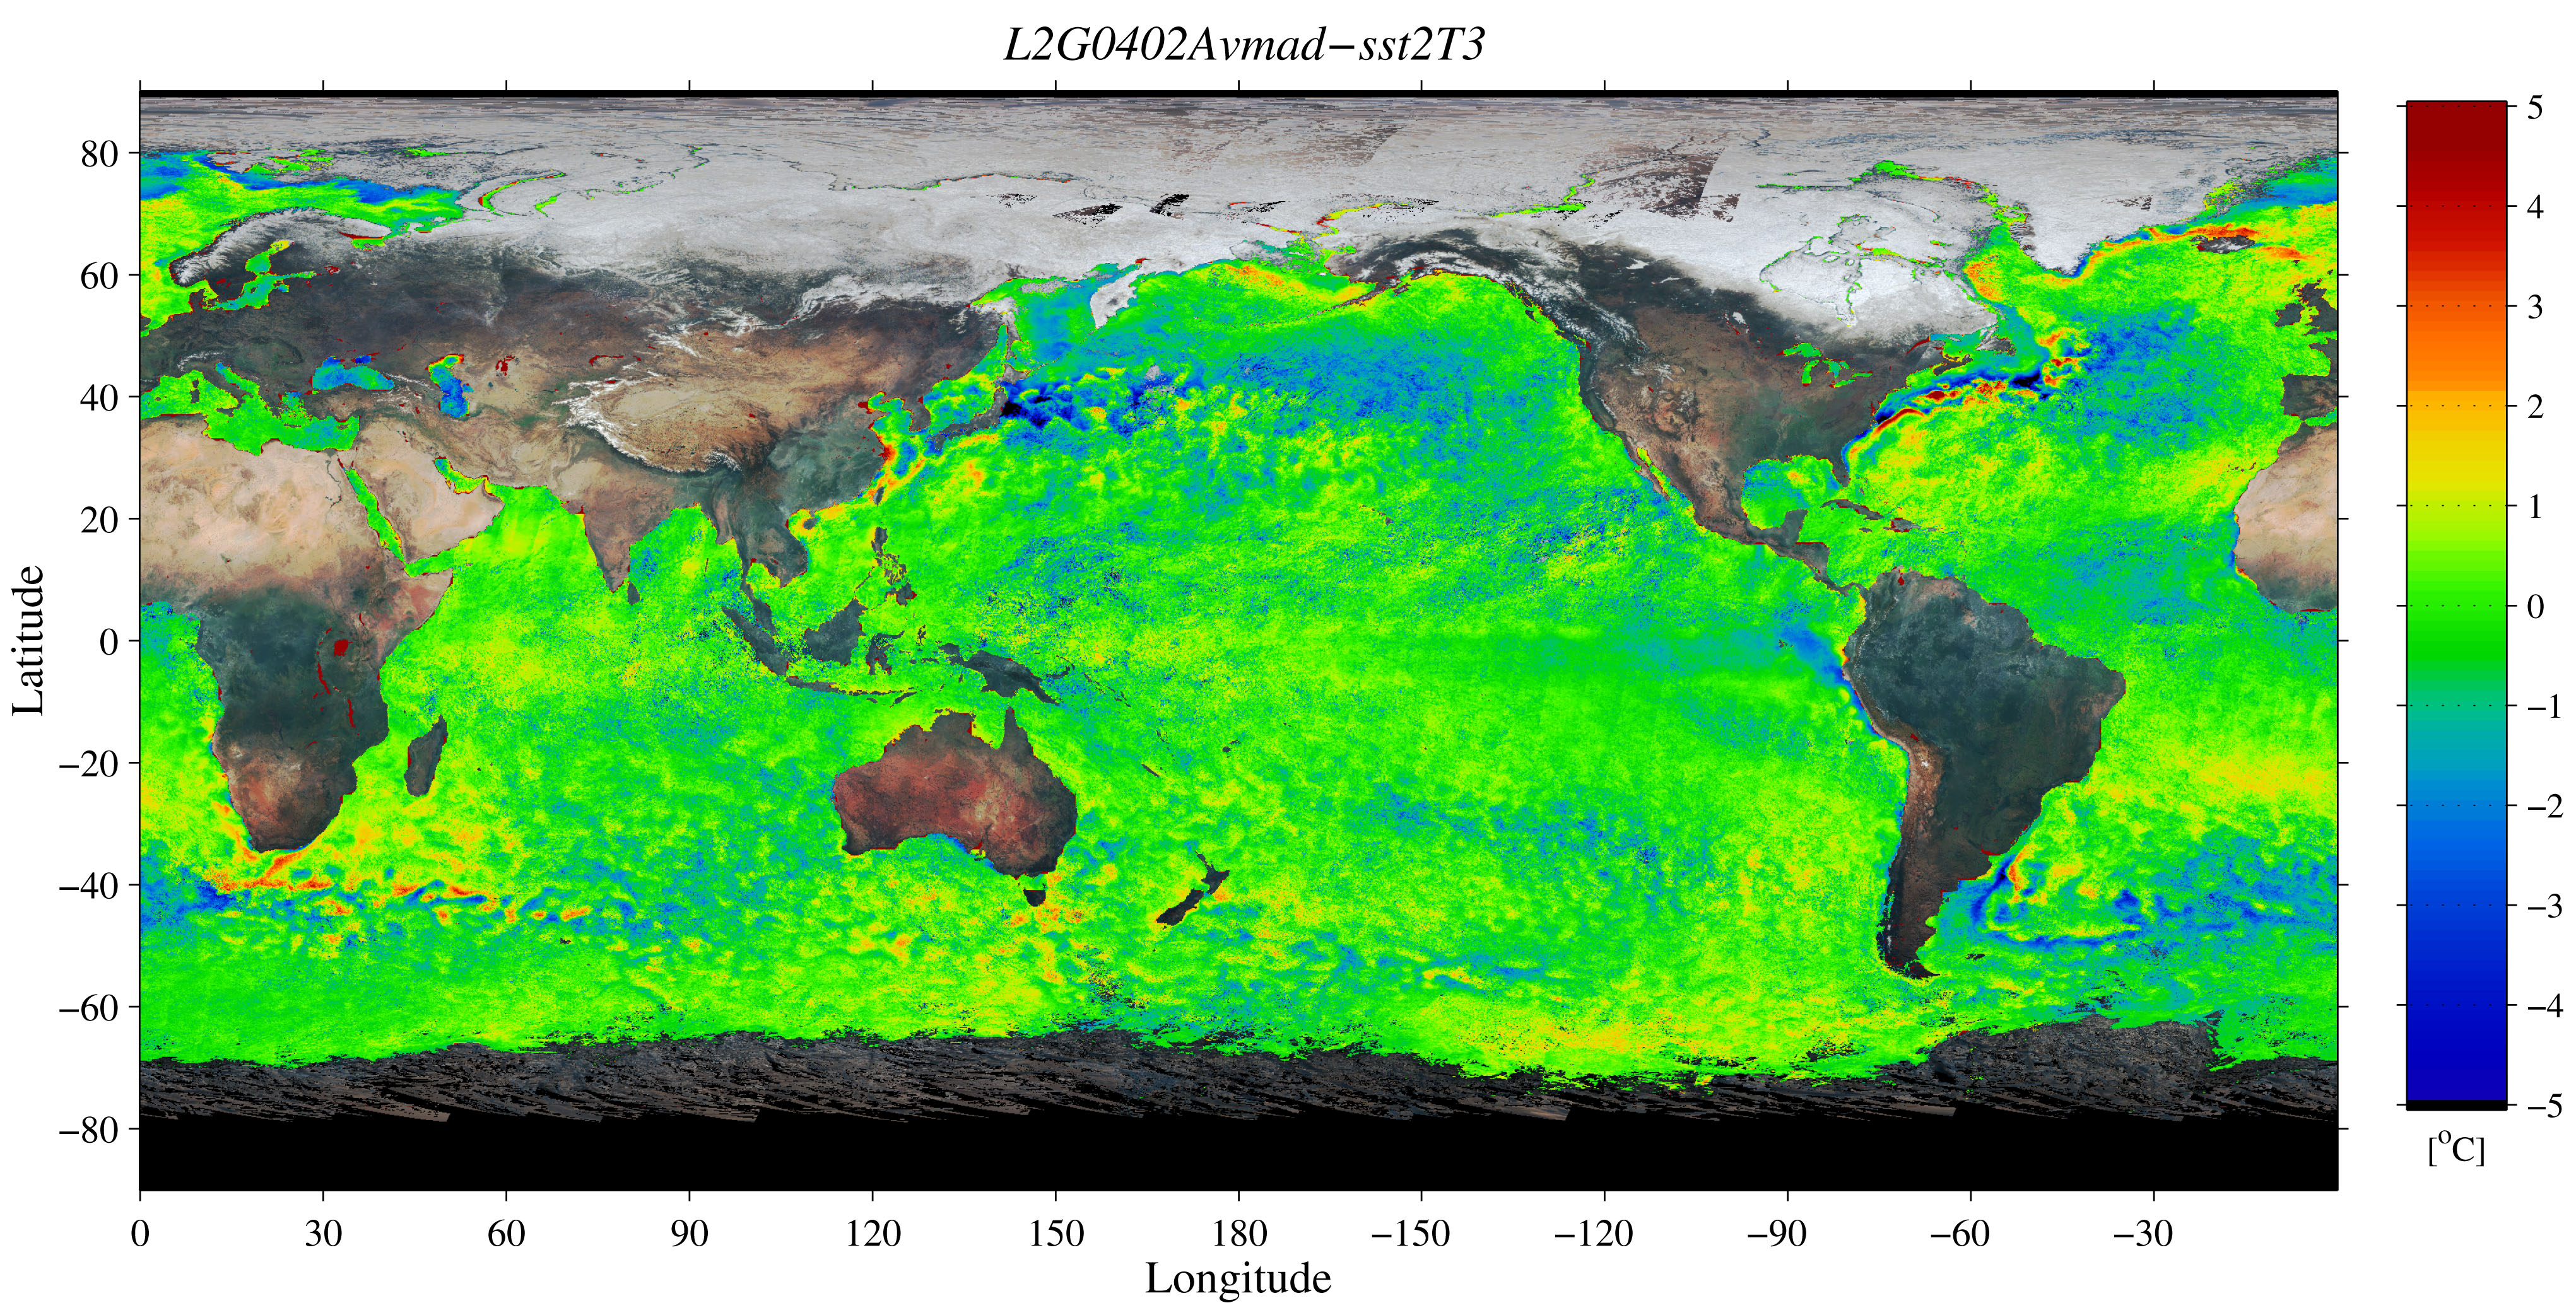
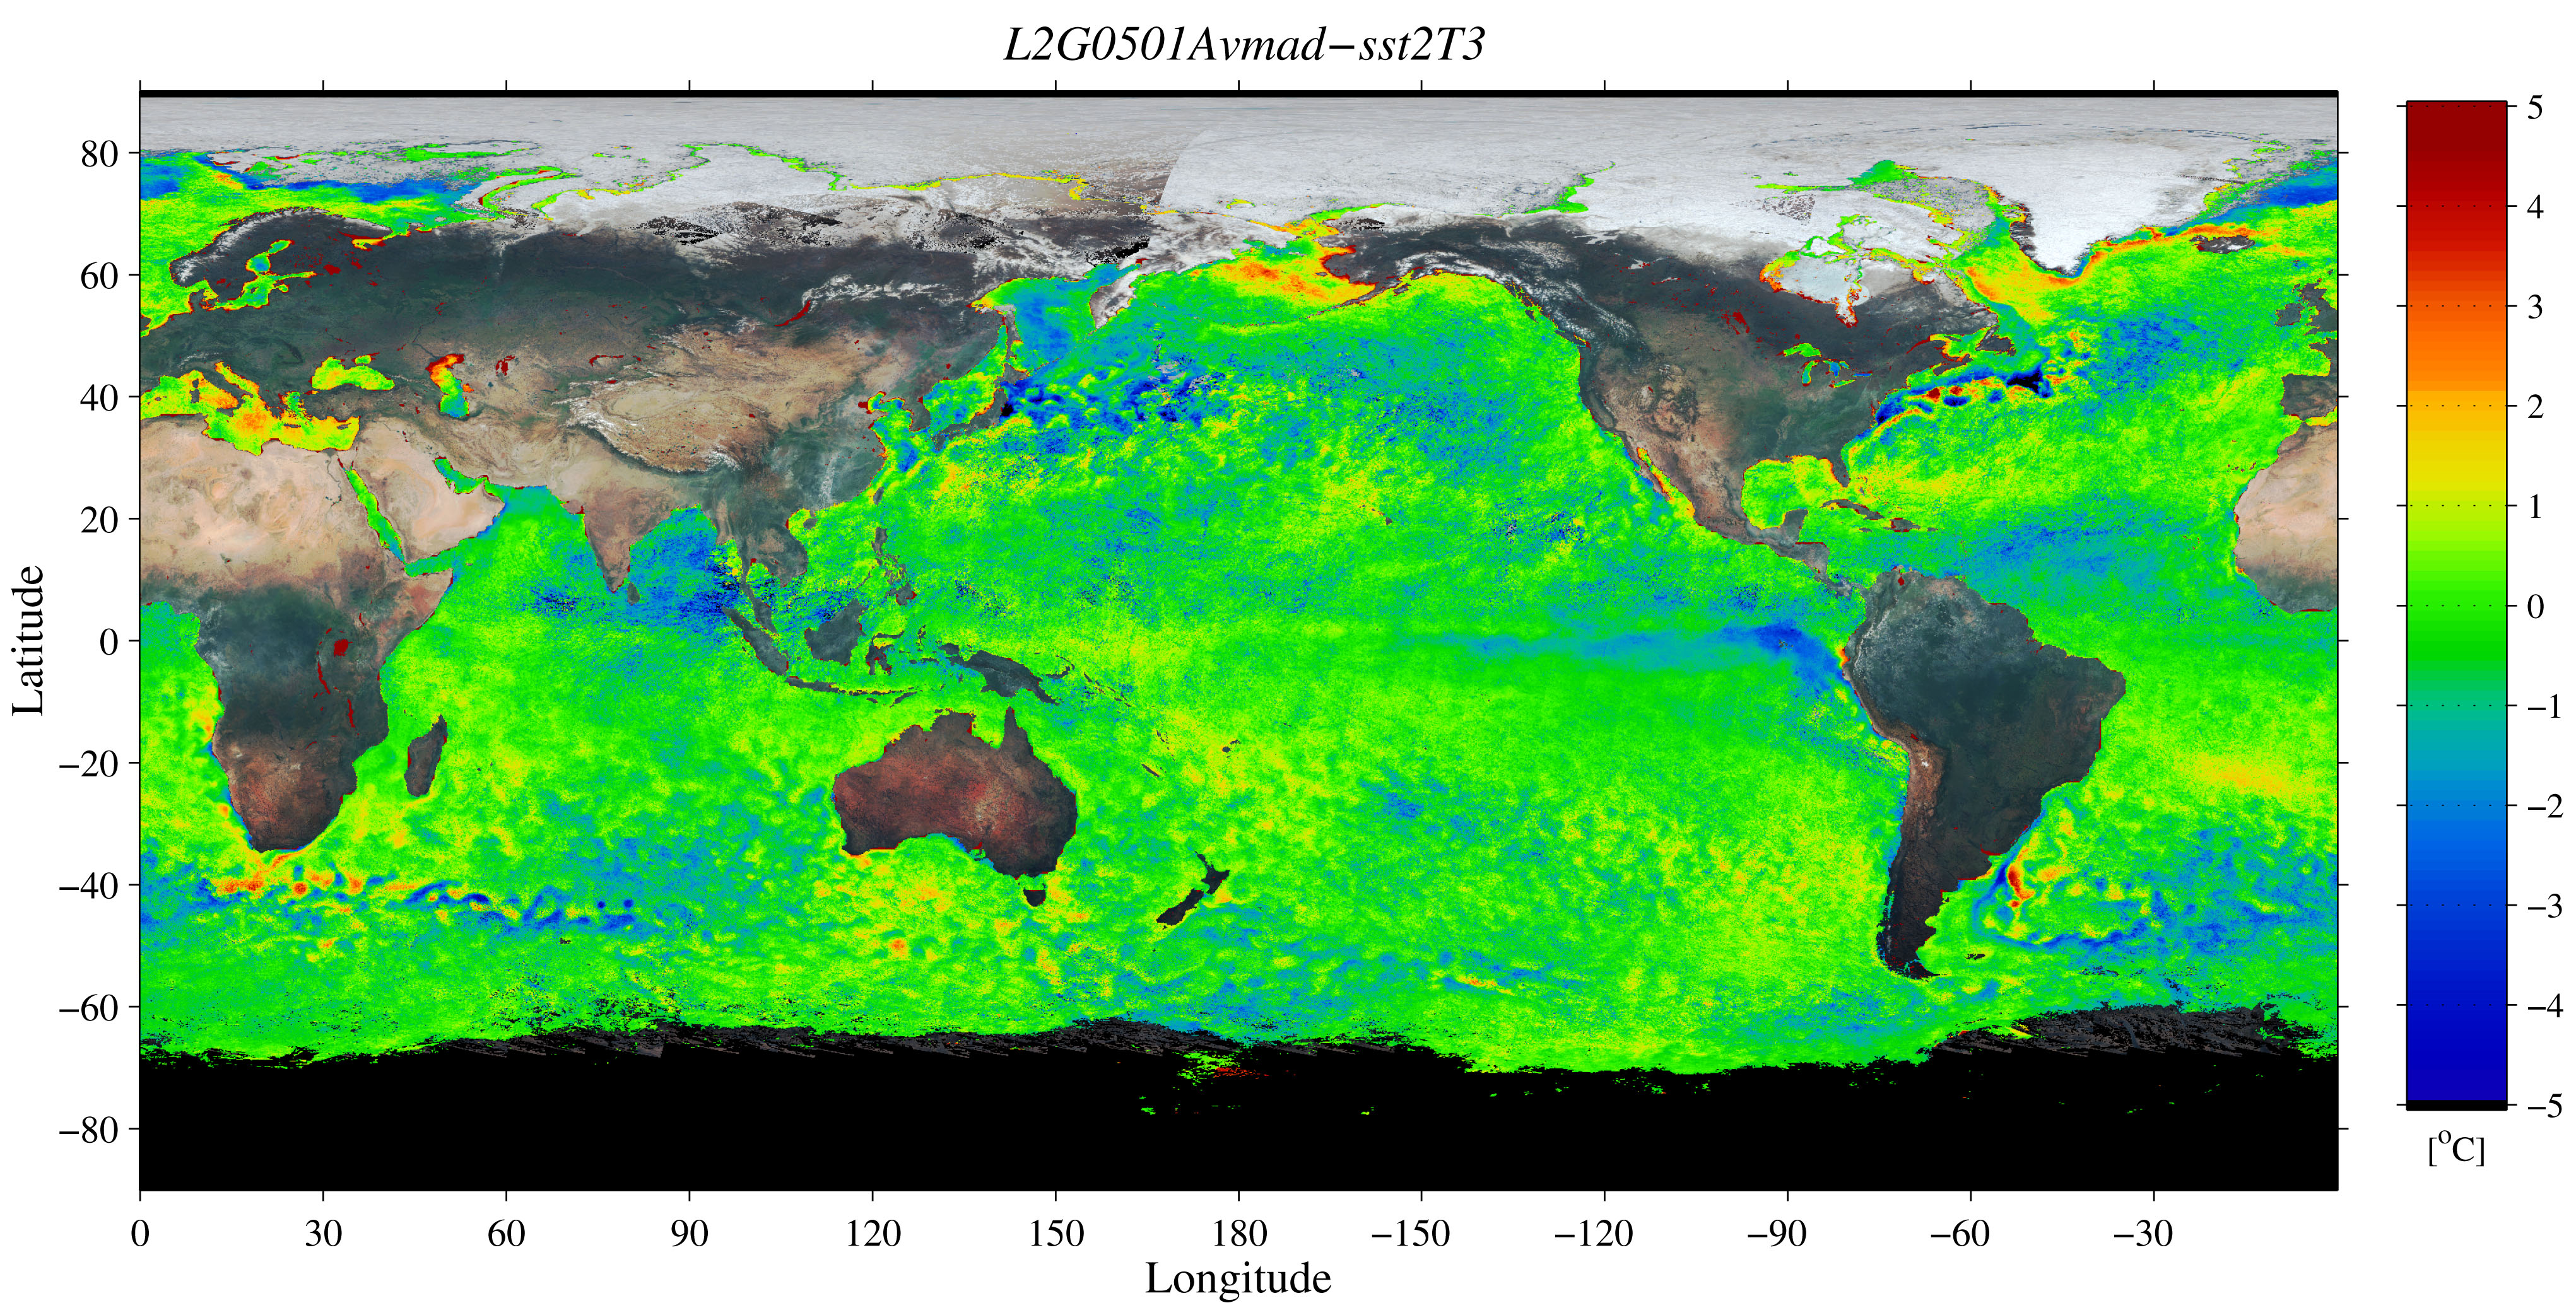
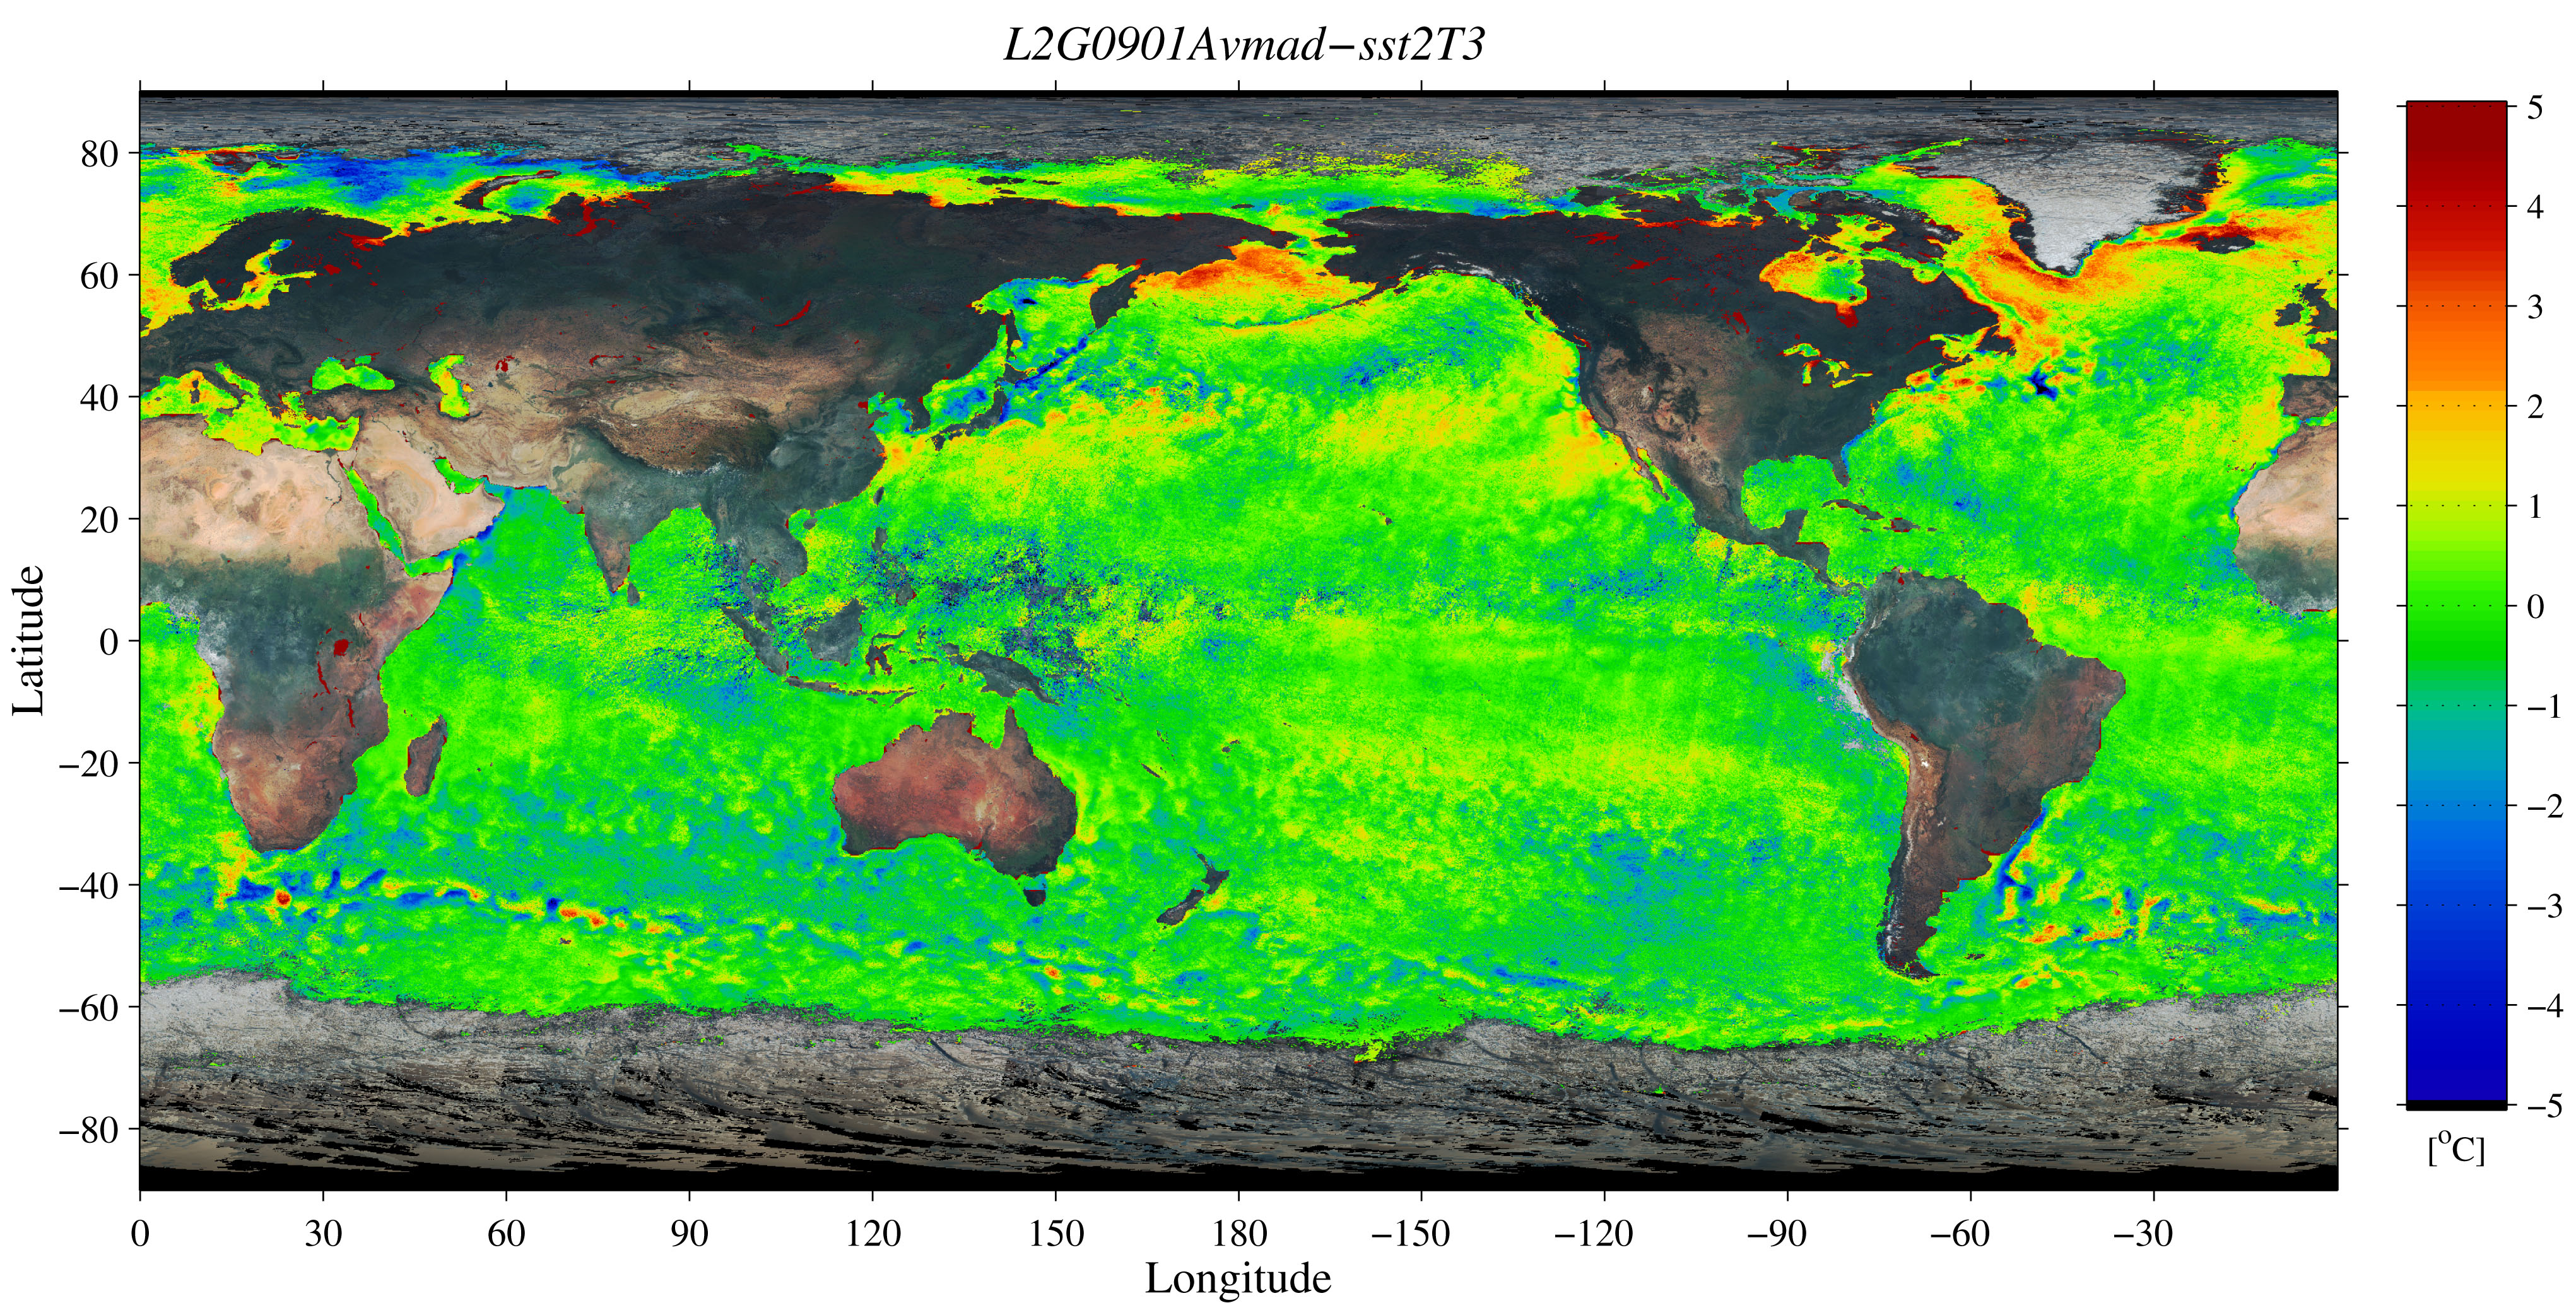
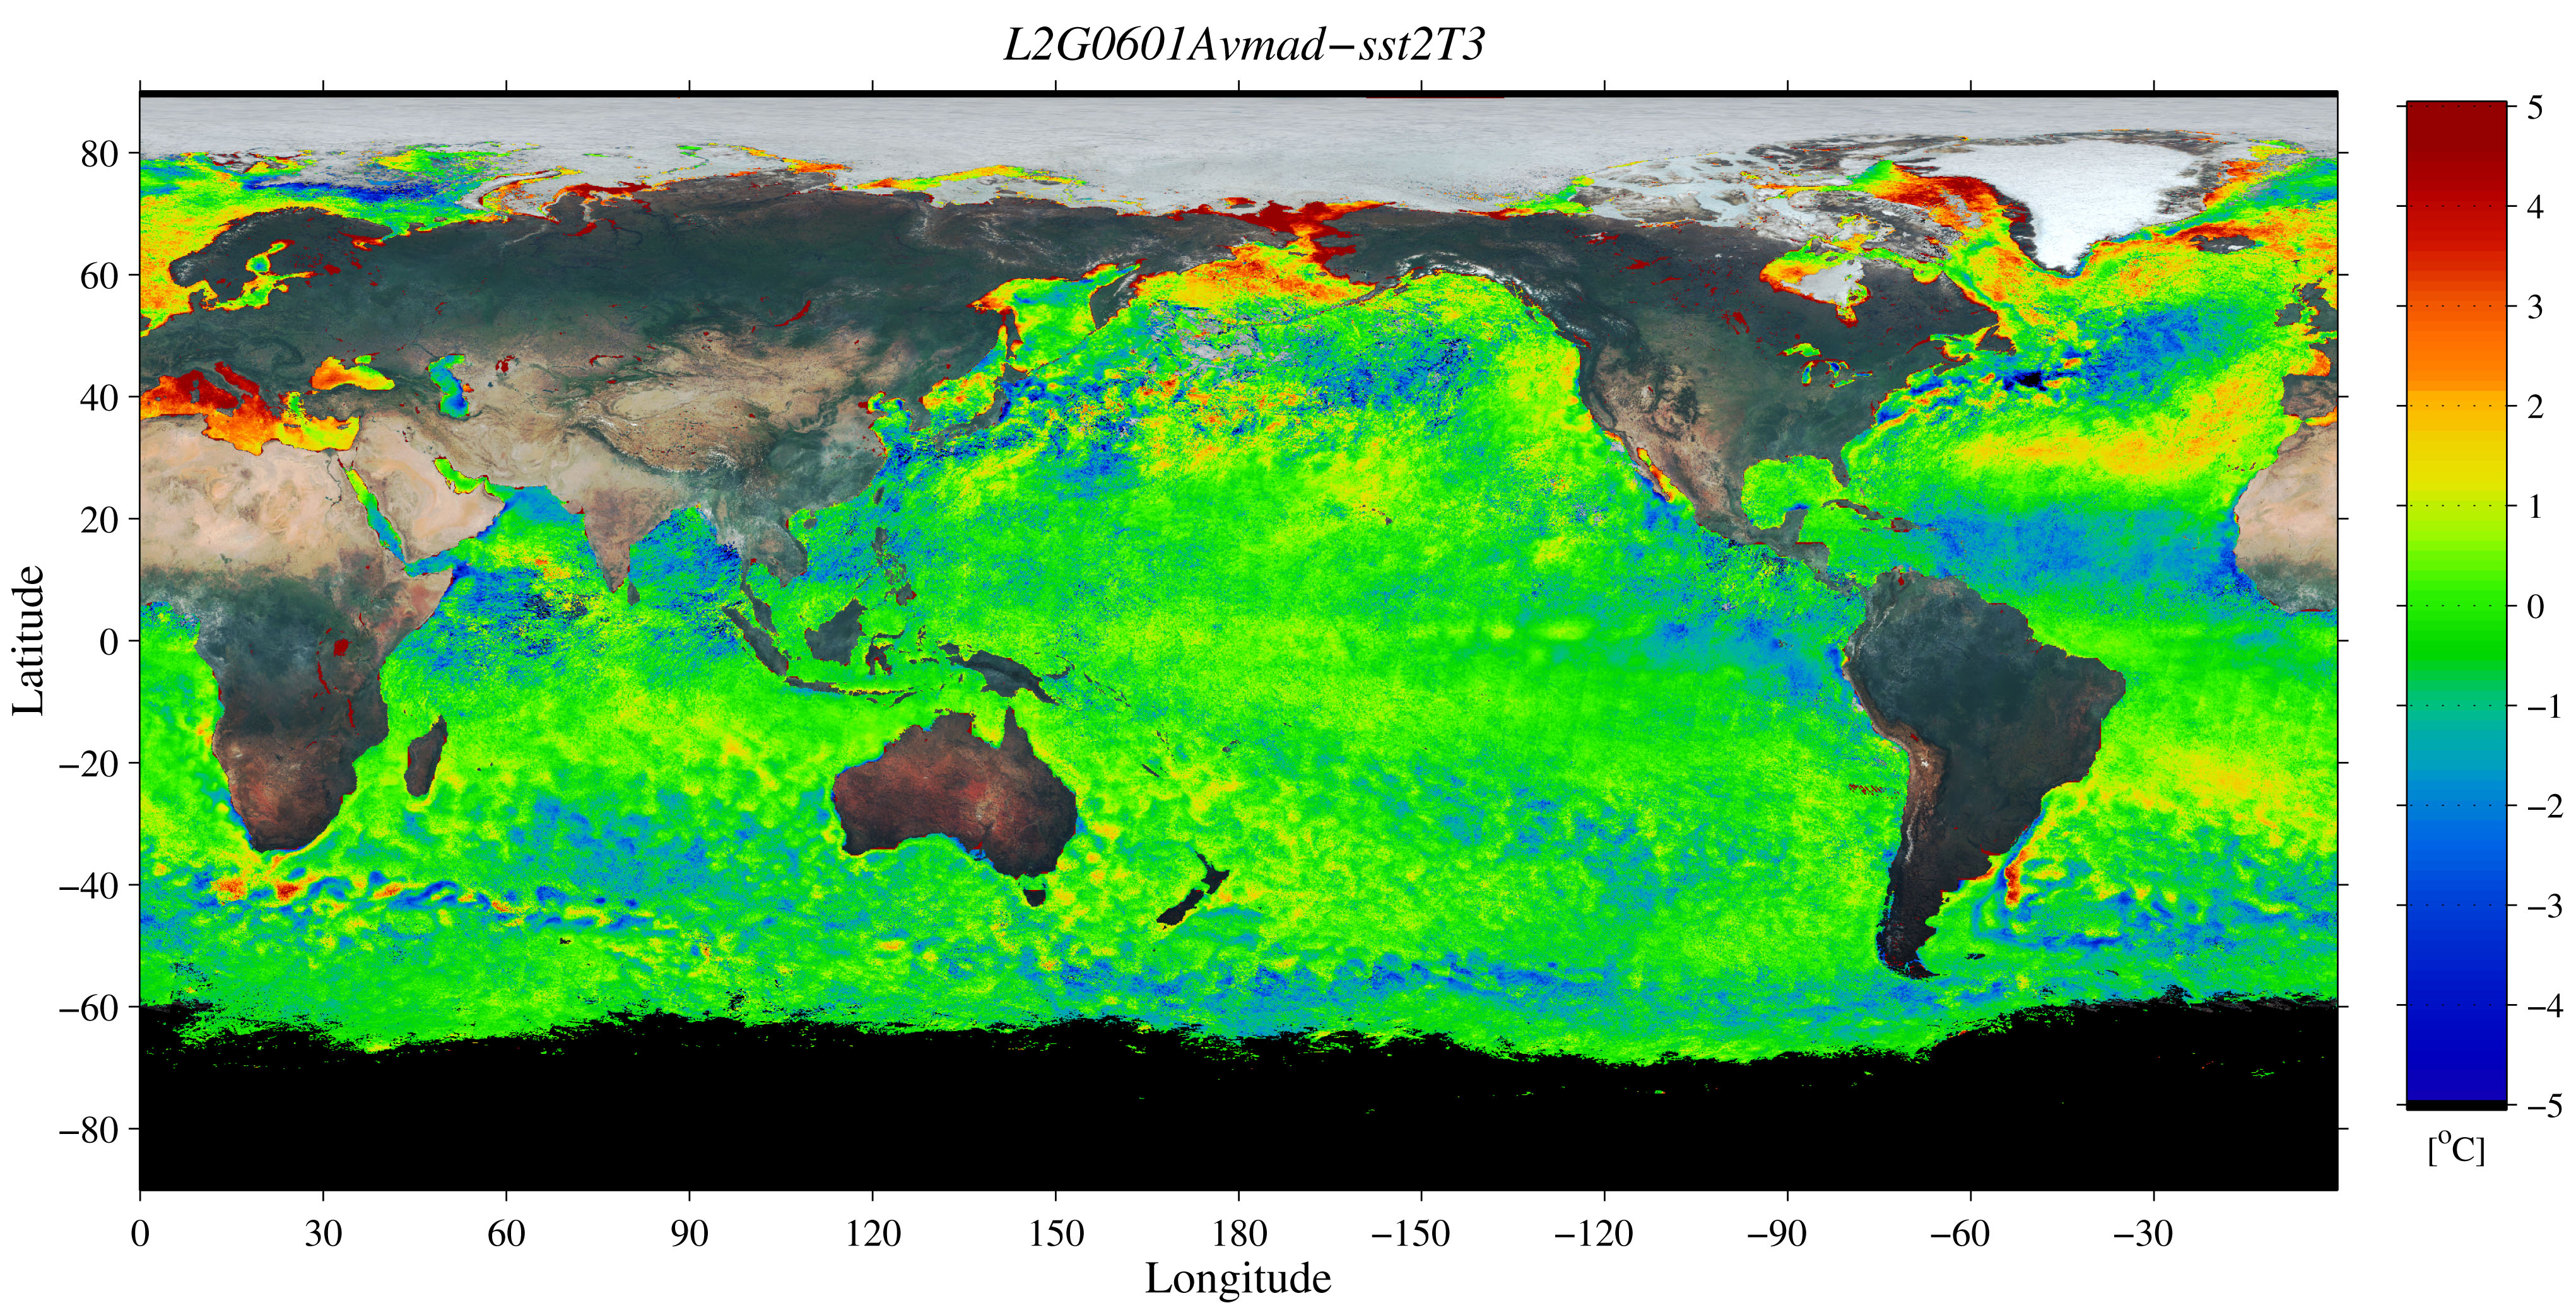
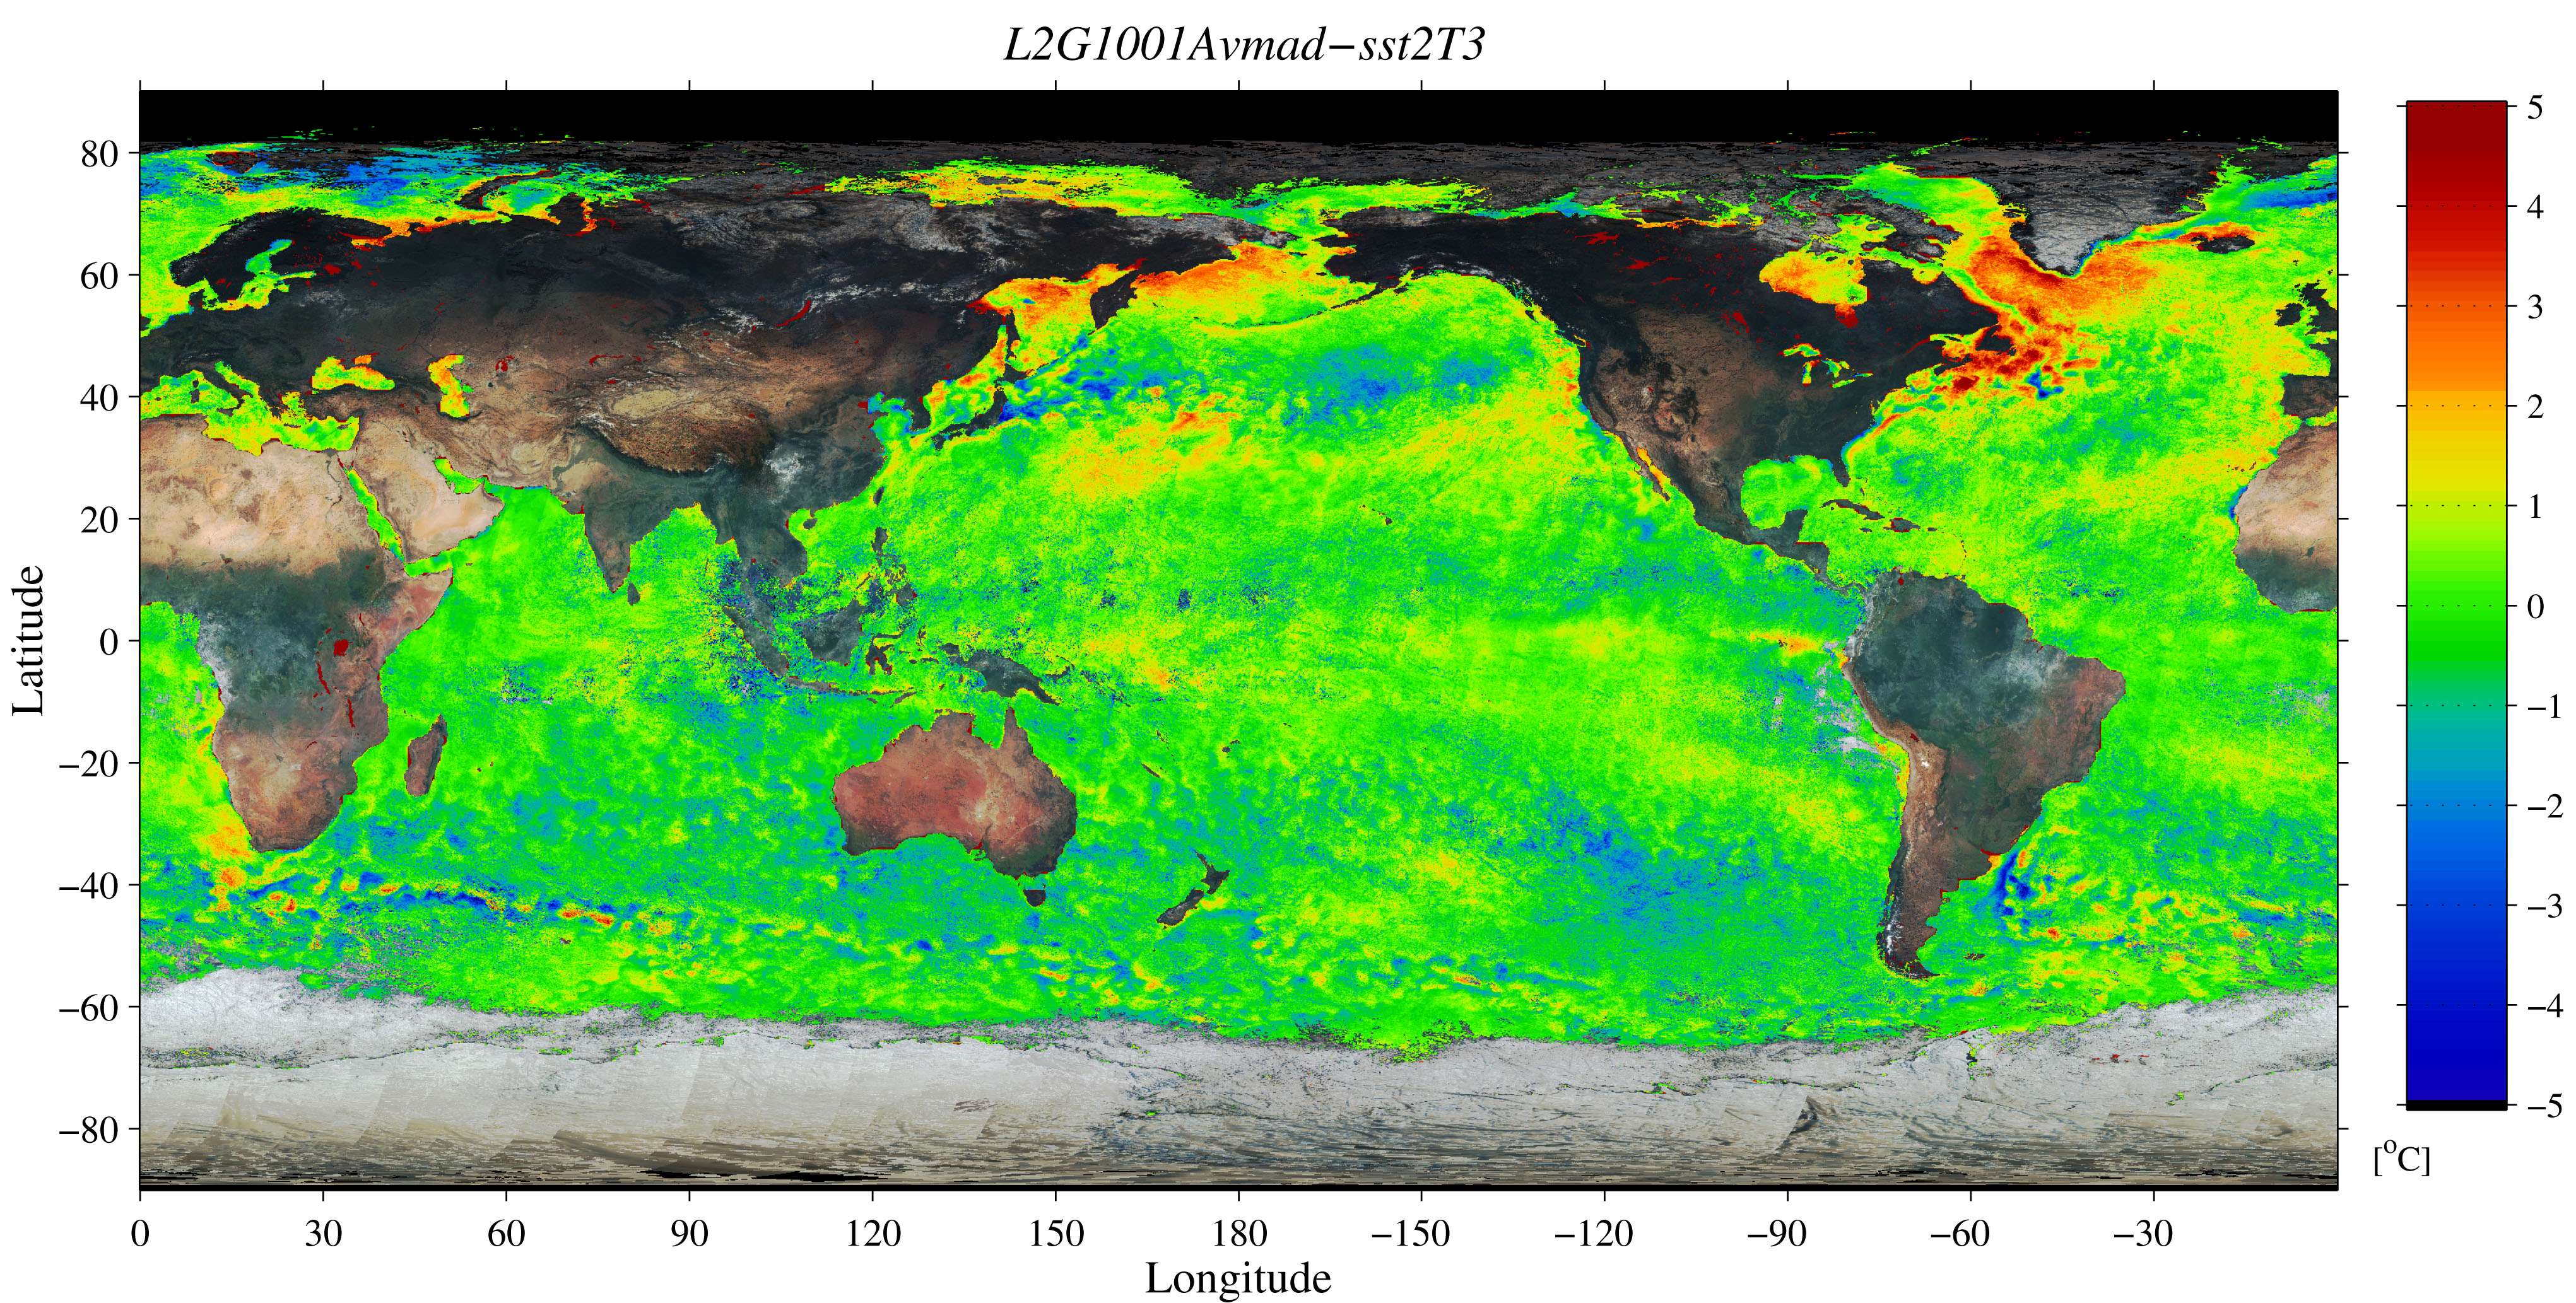
Above figures show sea surface temperature anomaly images observed by the Global Imager (GLI) aboard Midori-II (ADEOS-II) from March to October 2003. The anomaly is deviation from Reynolds SST climatology averaging during 1971-2000. GLI homepageEORC homepage