Aerosol
propaties by MAP method
Fukuda, S., and T. Nakajima,
xxxx
Center for Climate System Research, The University of
Tokyo, Jan. 2008
Get Binary data
Daily data: DAILY/*
Monthly
data: MONTHLY/*
Note:
Area: -180~180deg E,
-90~+90deg N (from south to north), 0.125 deg grid
Binary type: 4-byte
float binary (little endian, 4*2880*1441)
Parameter and file
name:
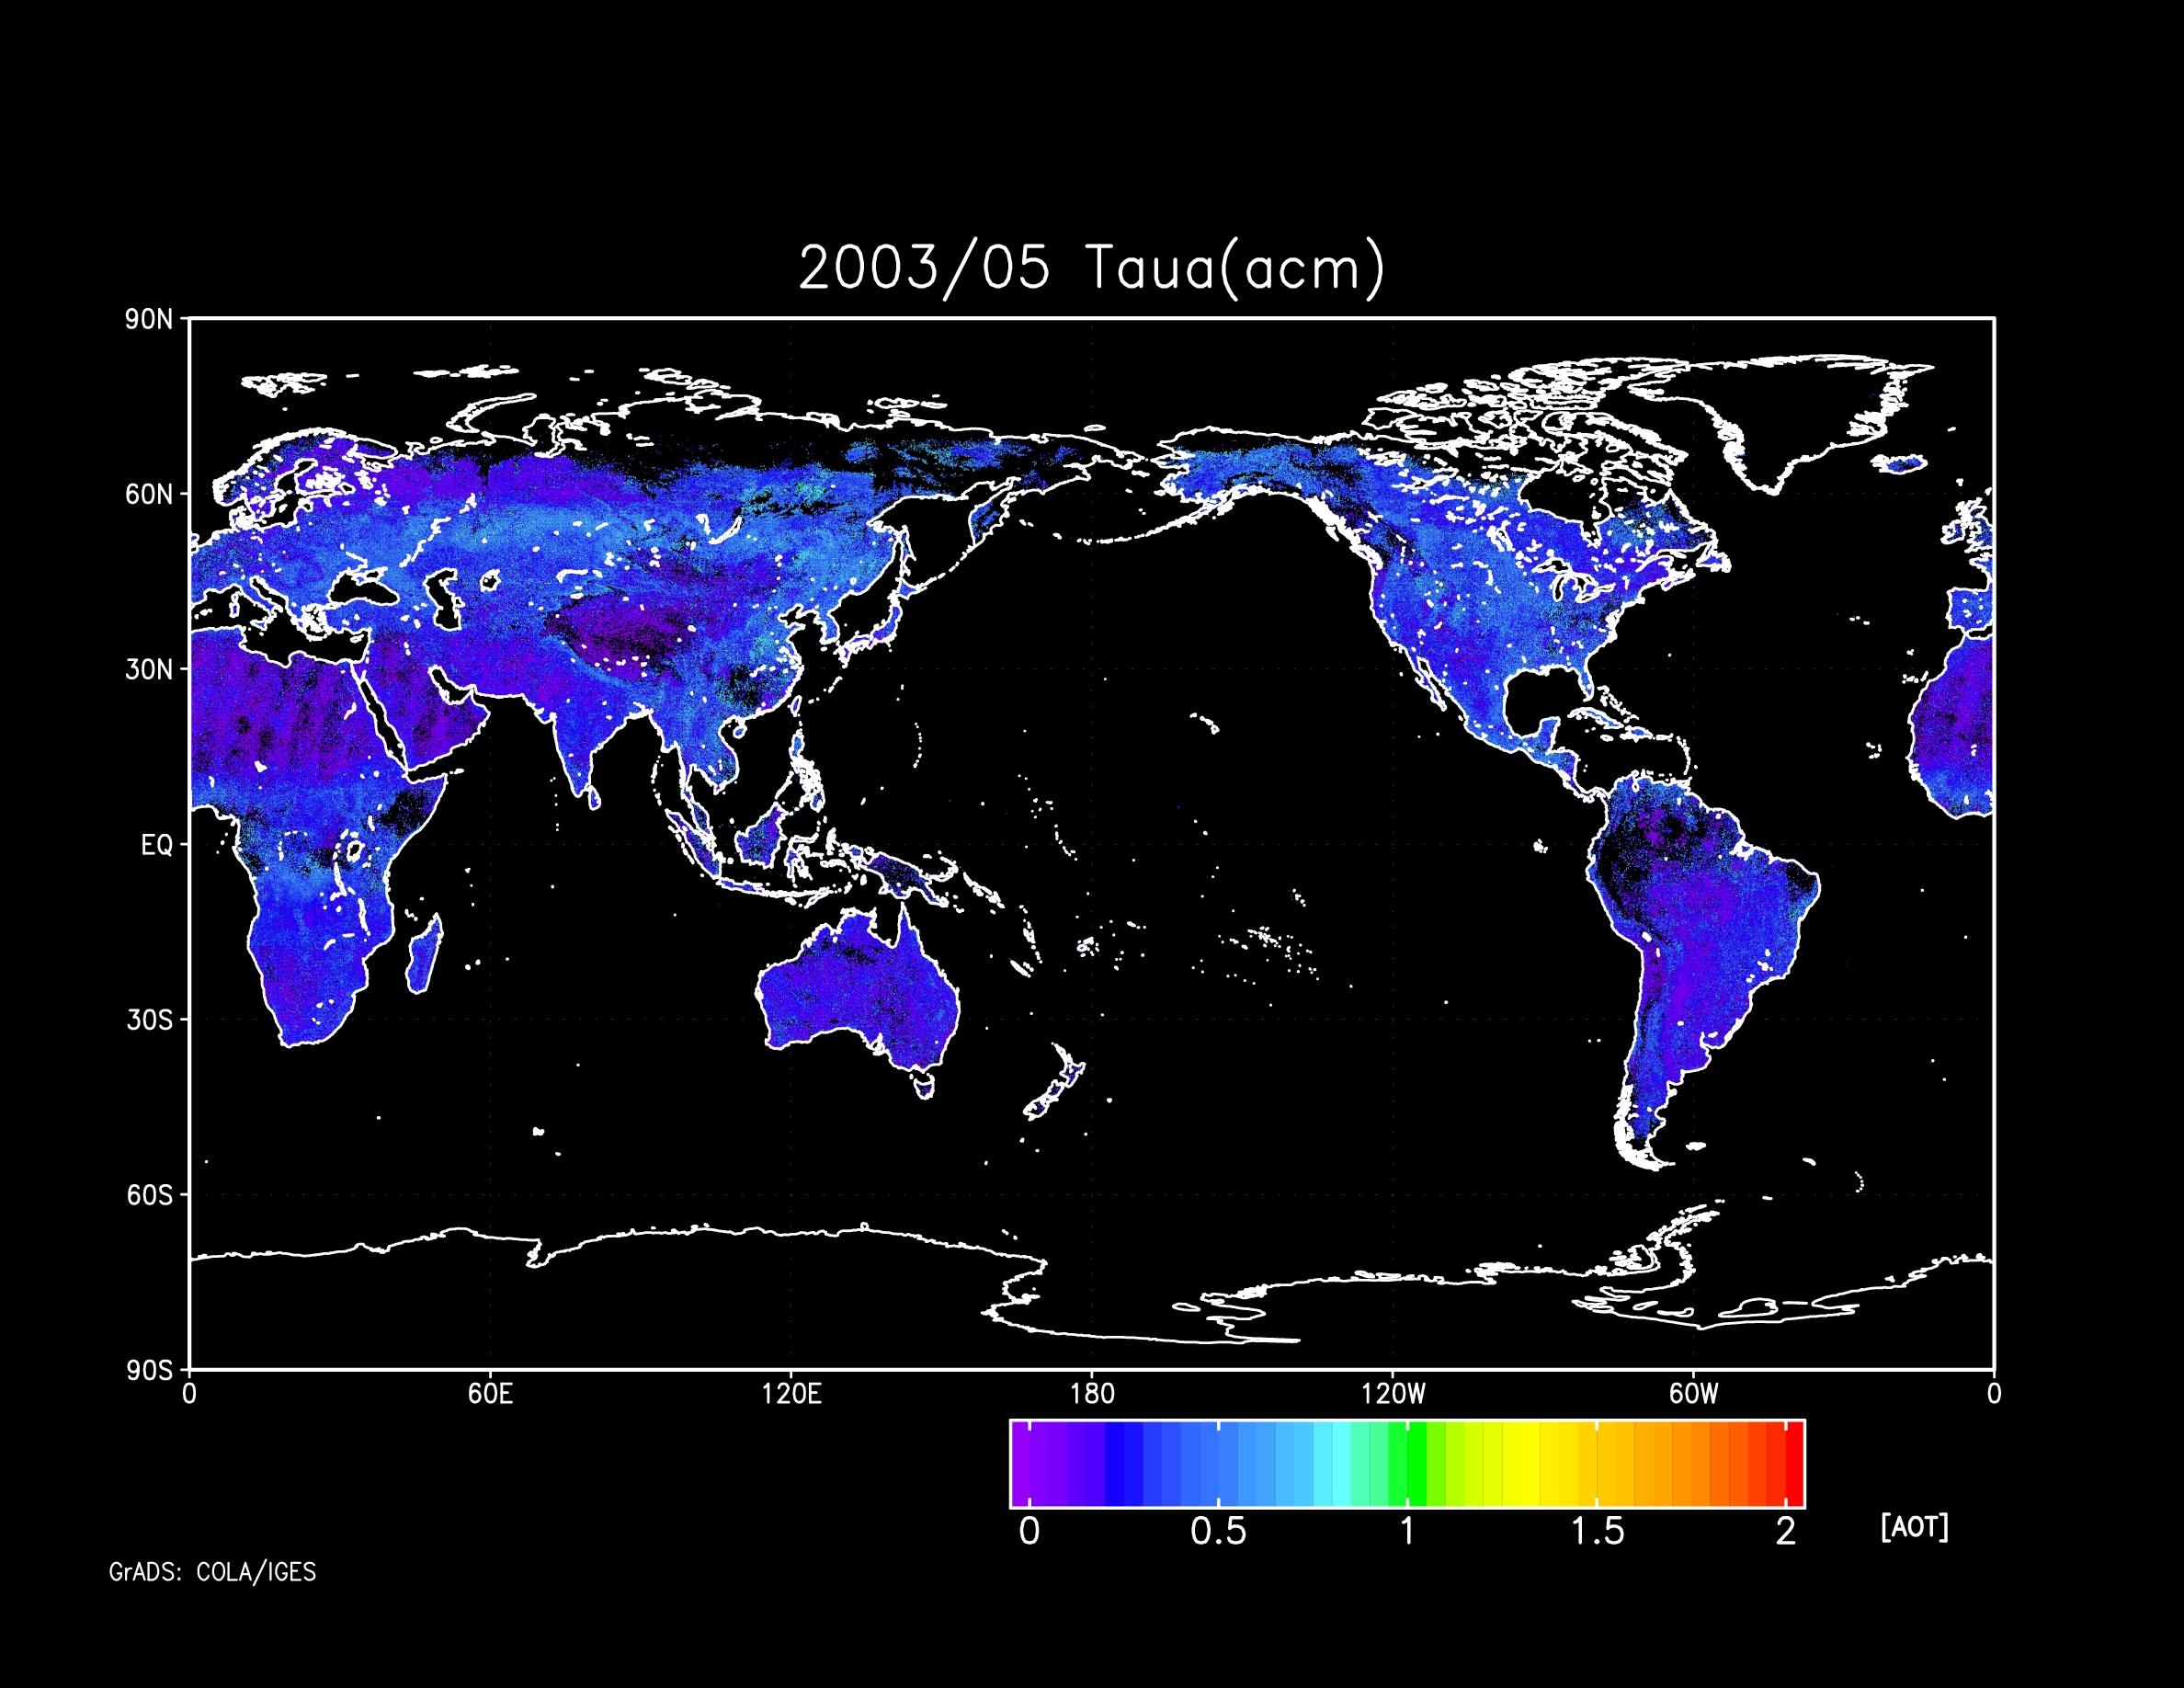
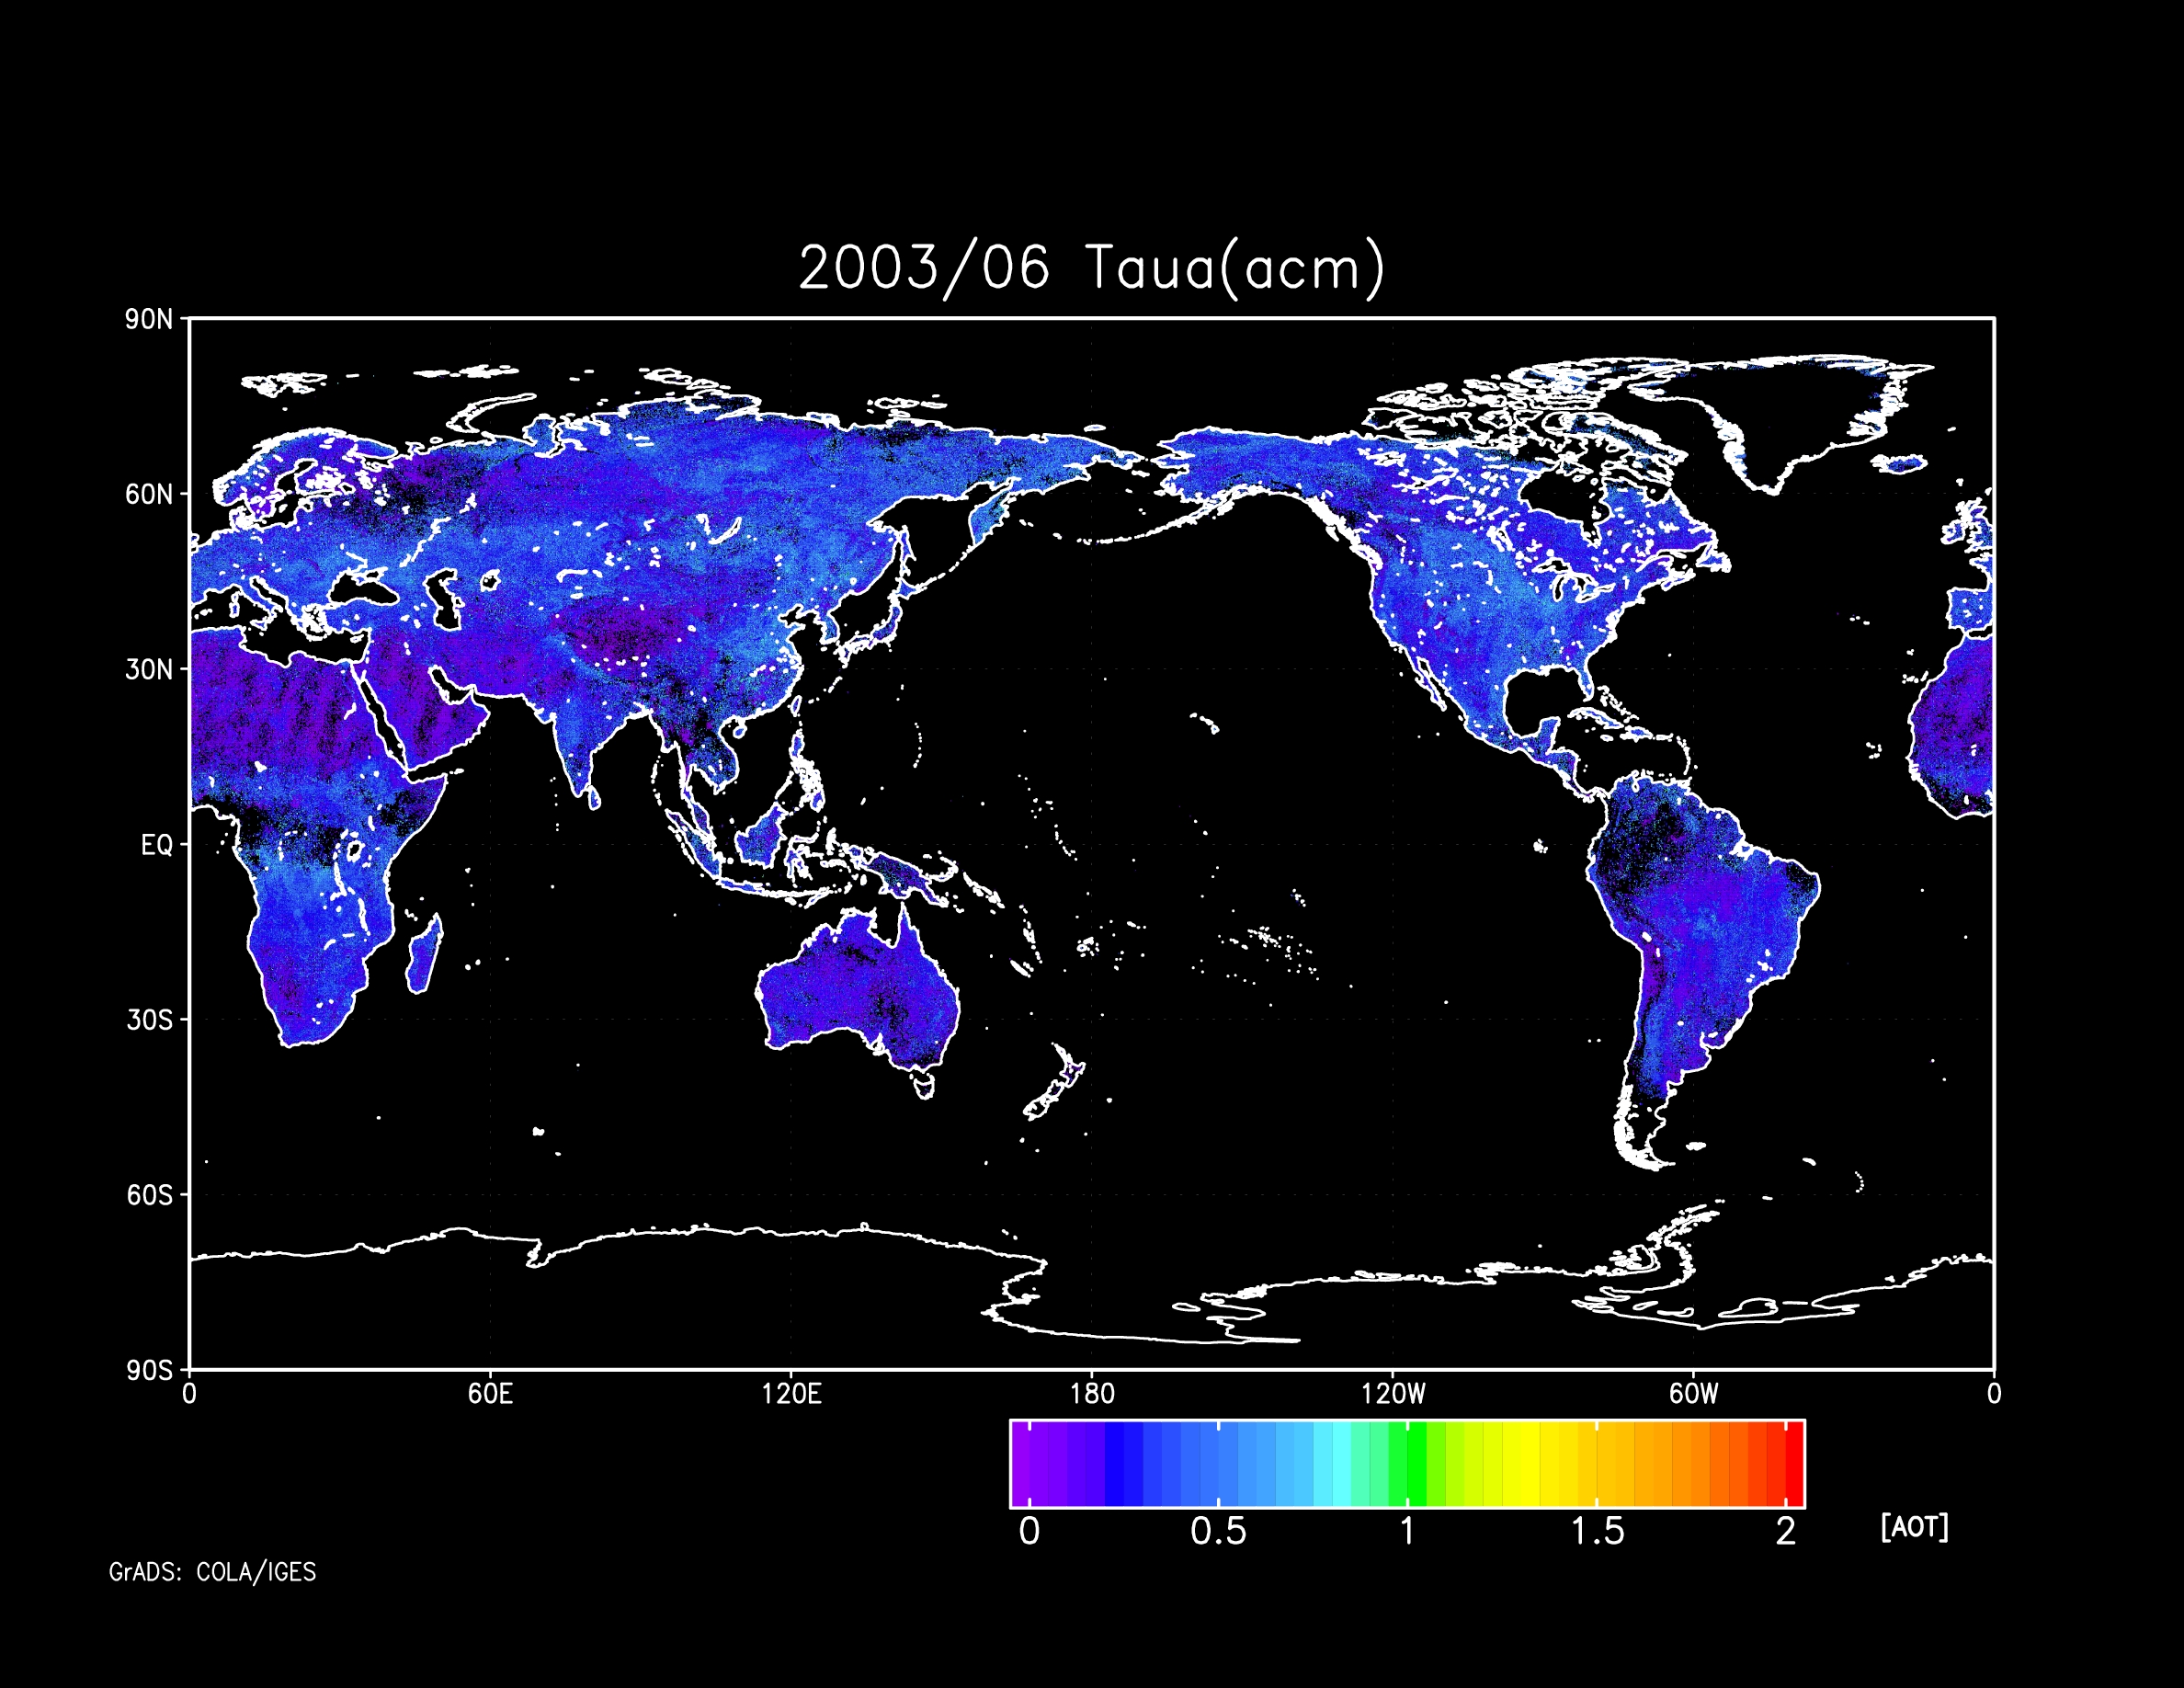
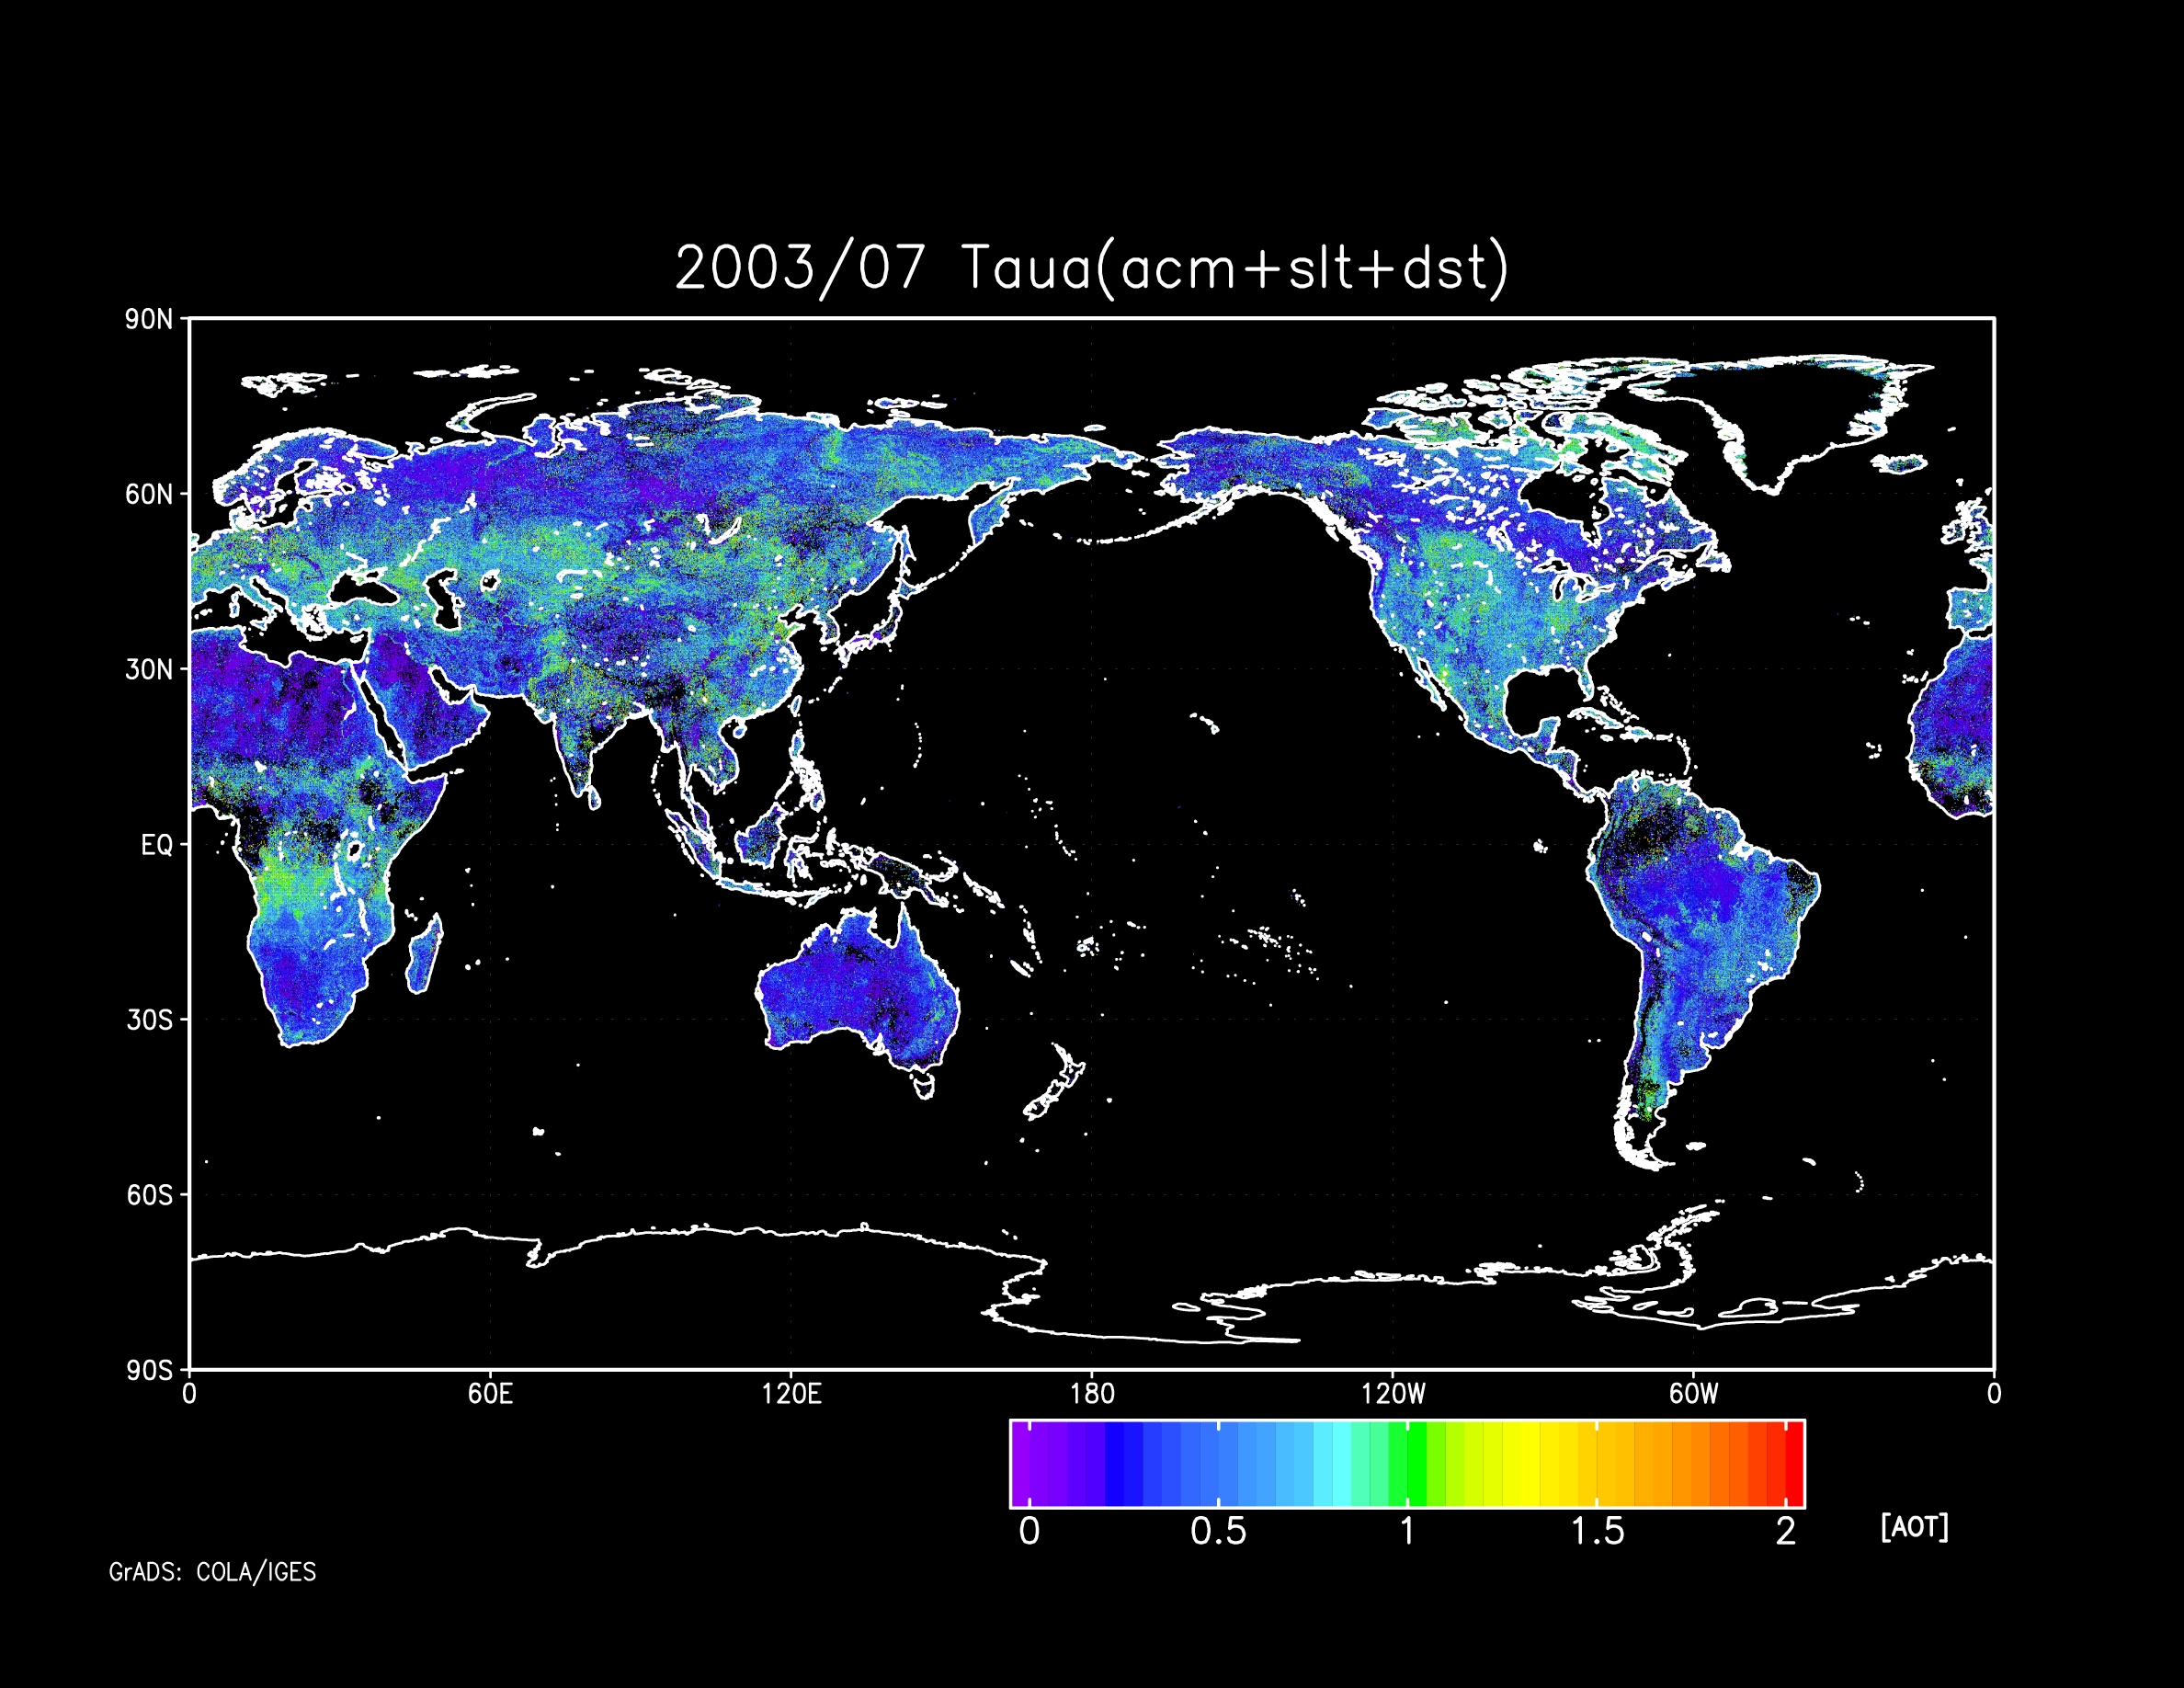
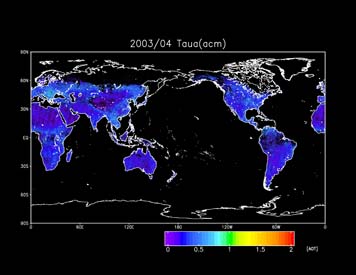
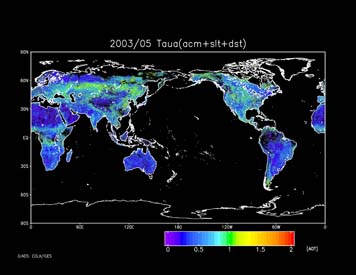
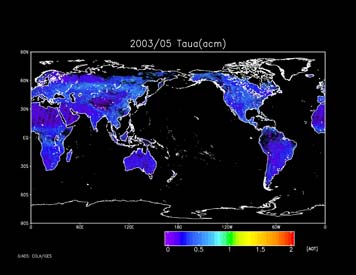
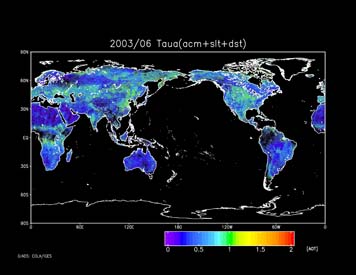
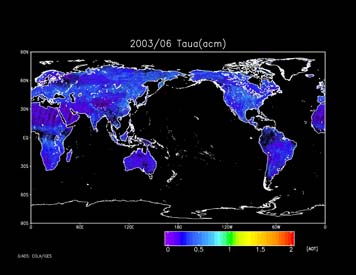
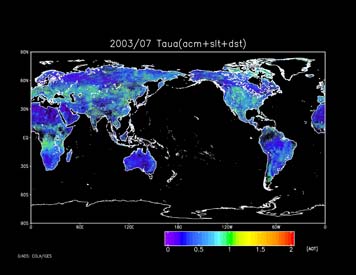
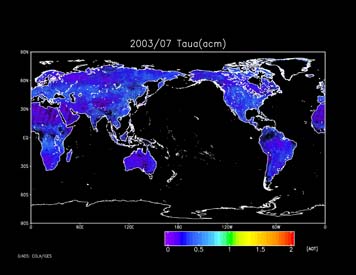
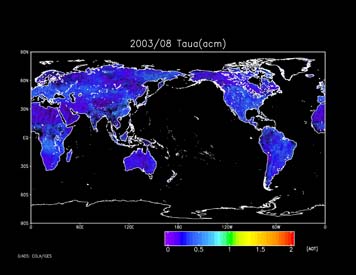
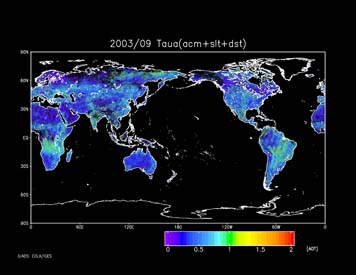
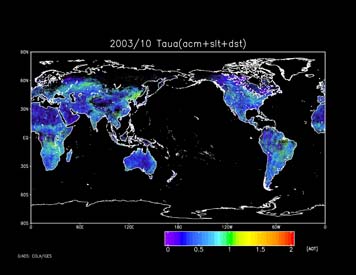
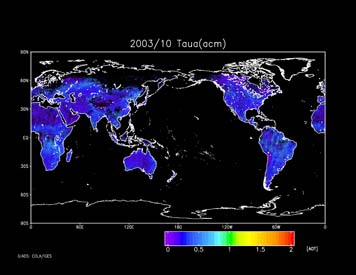
Taua-acm (optical thickness of accumulation mode
aerosol)
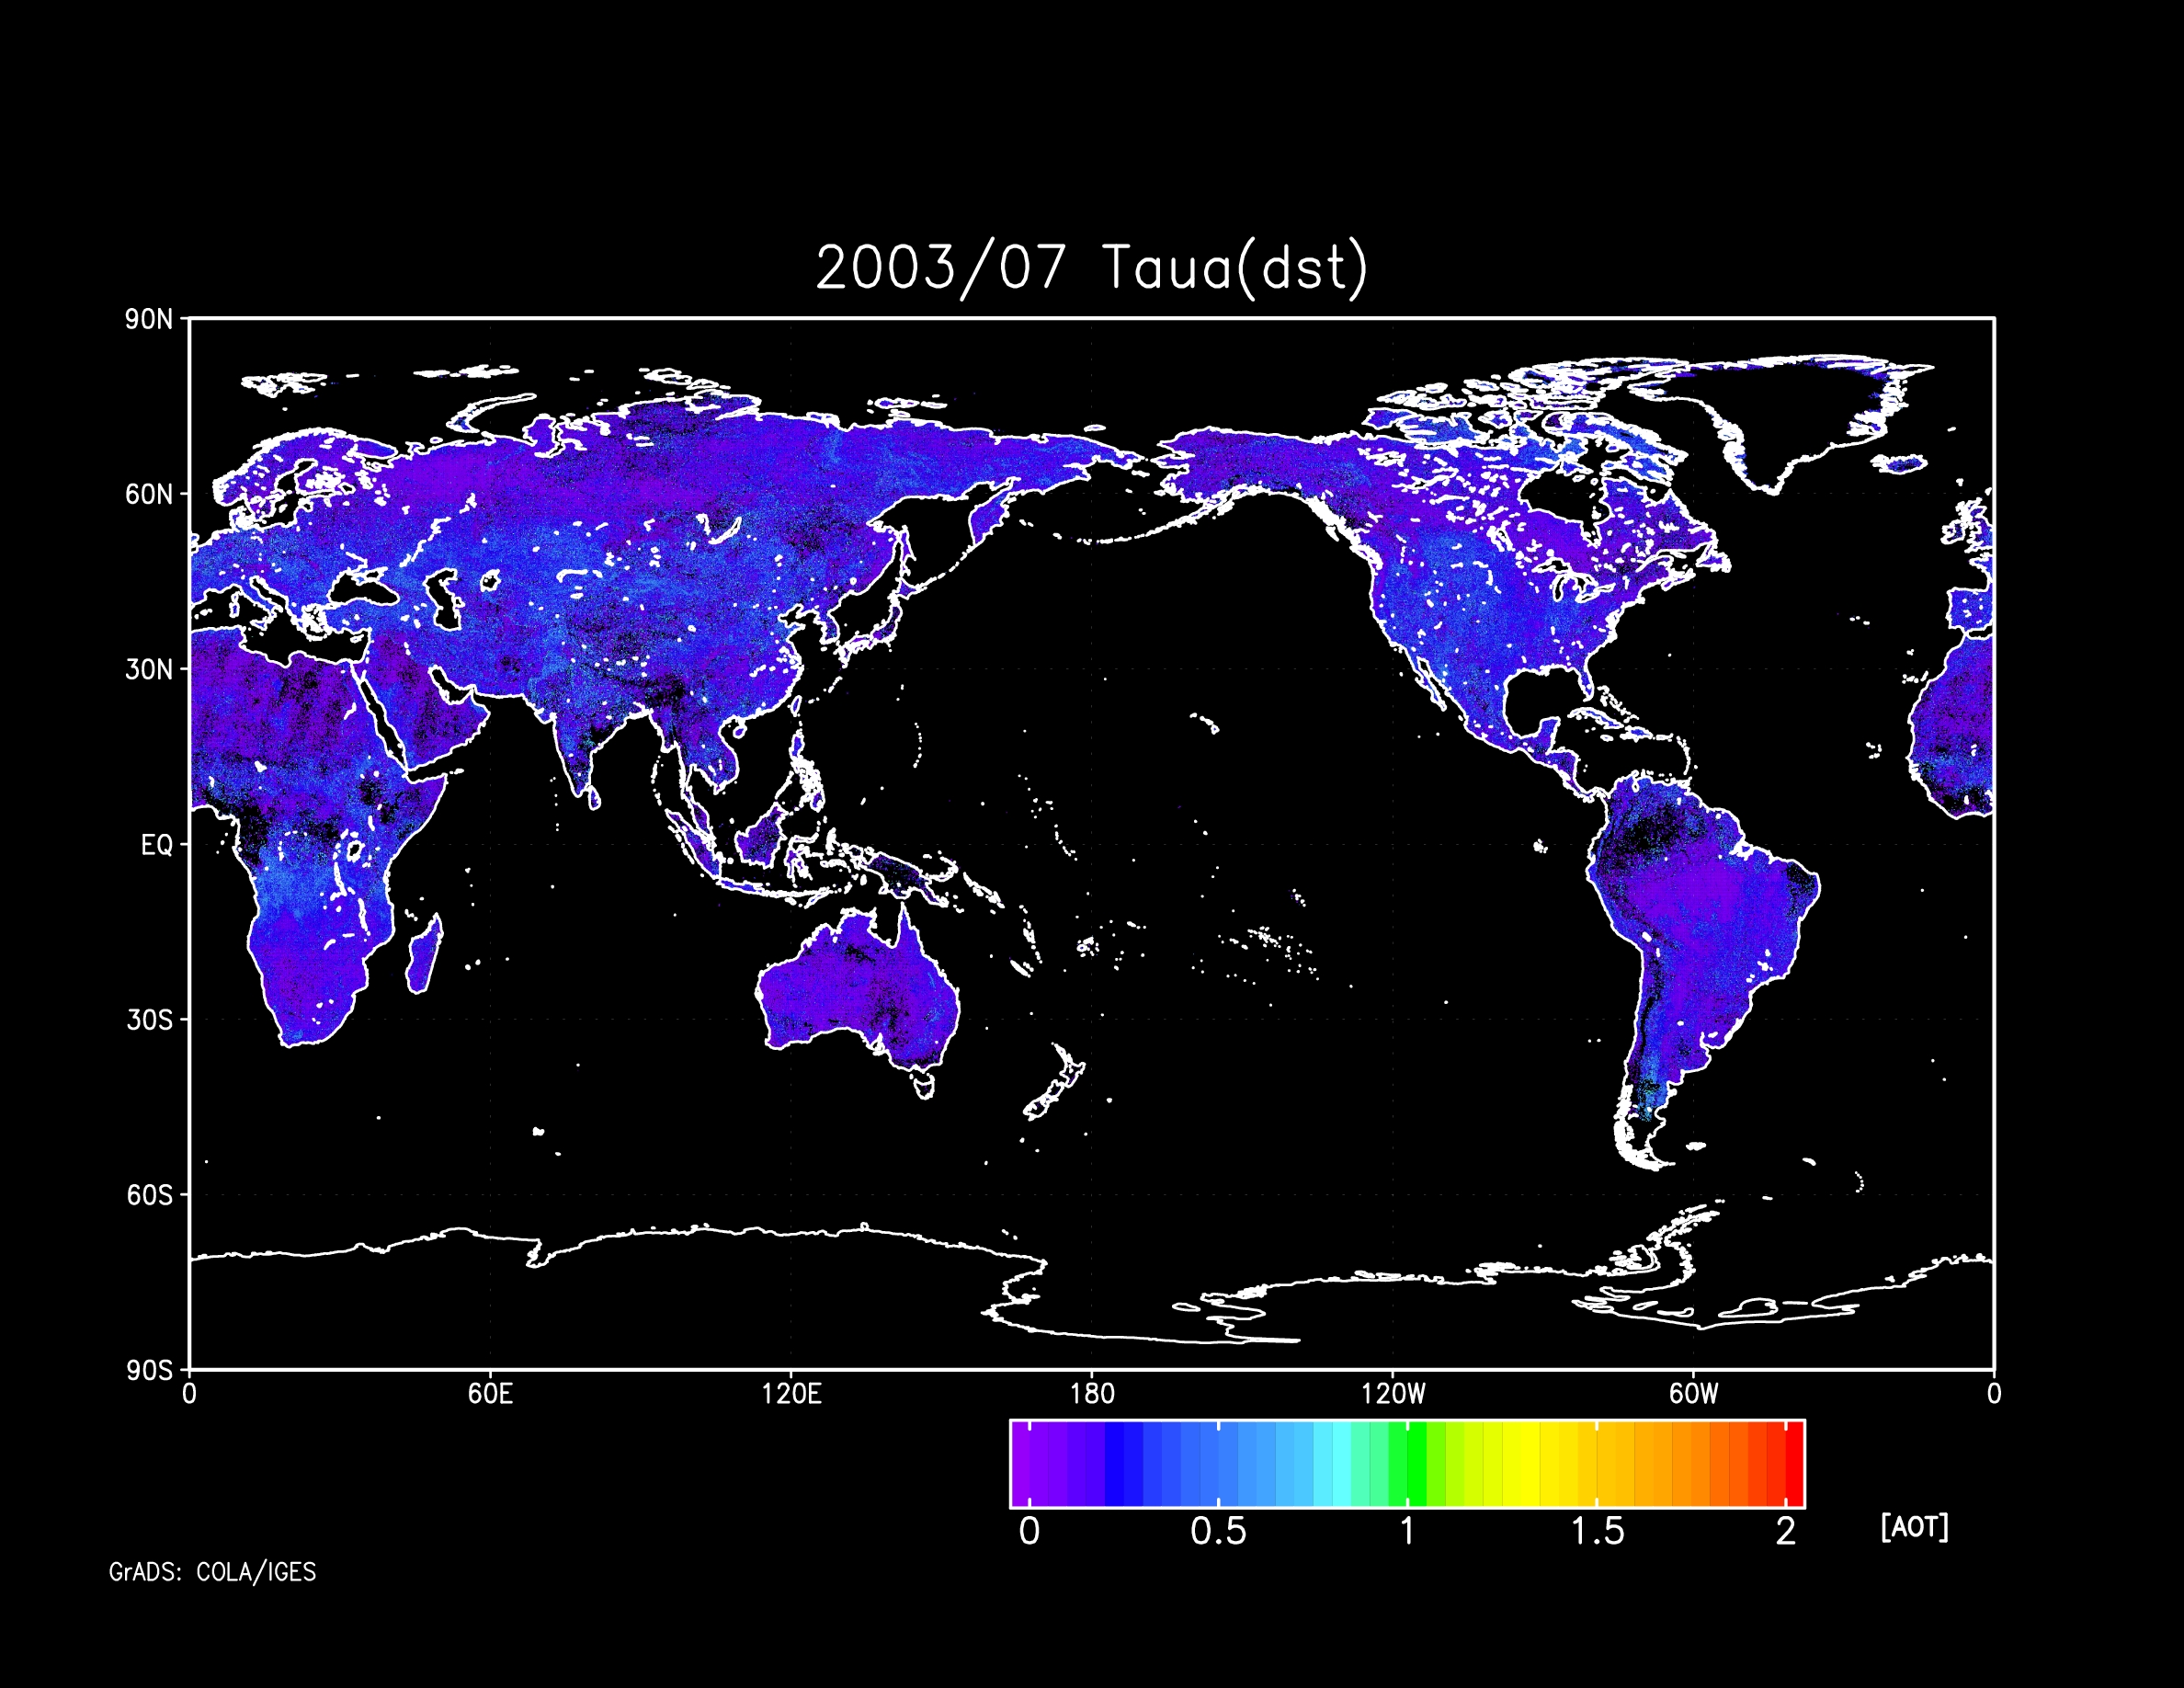
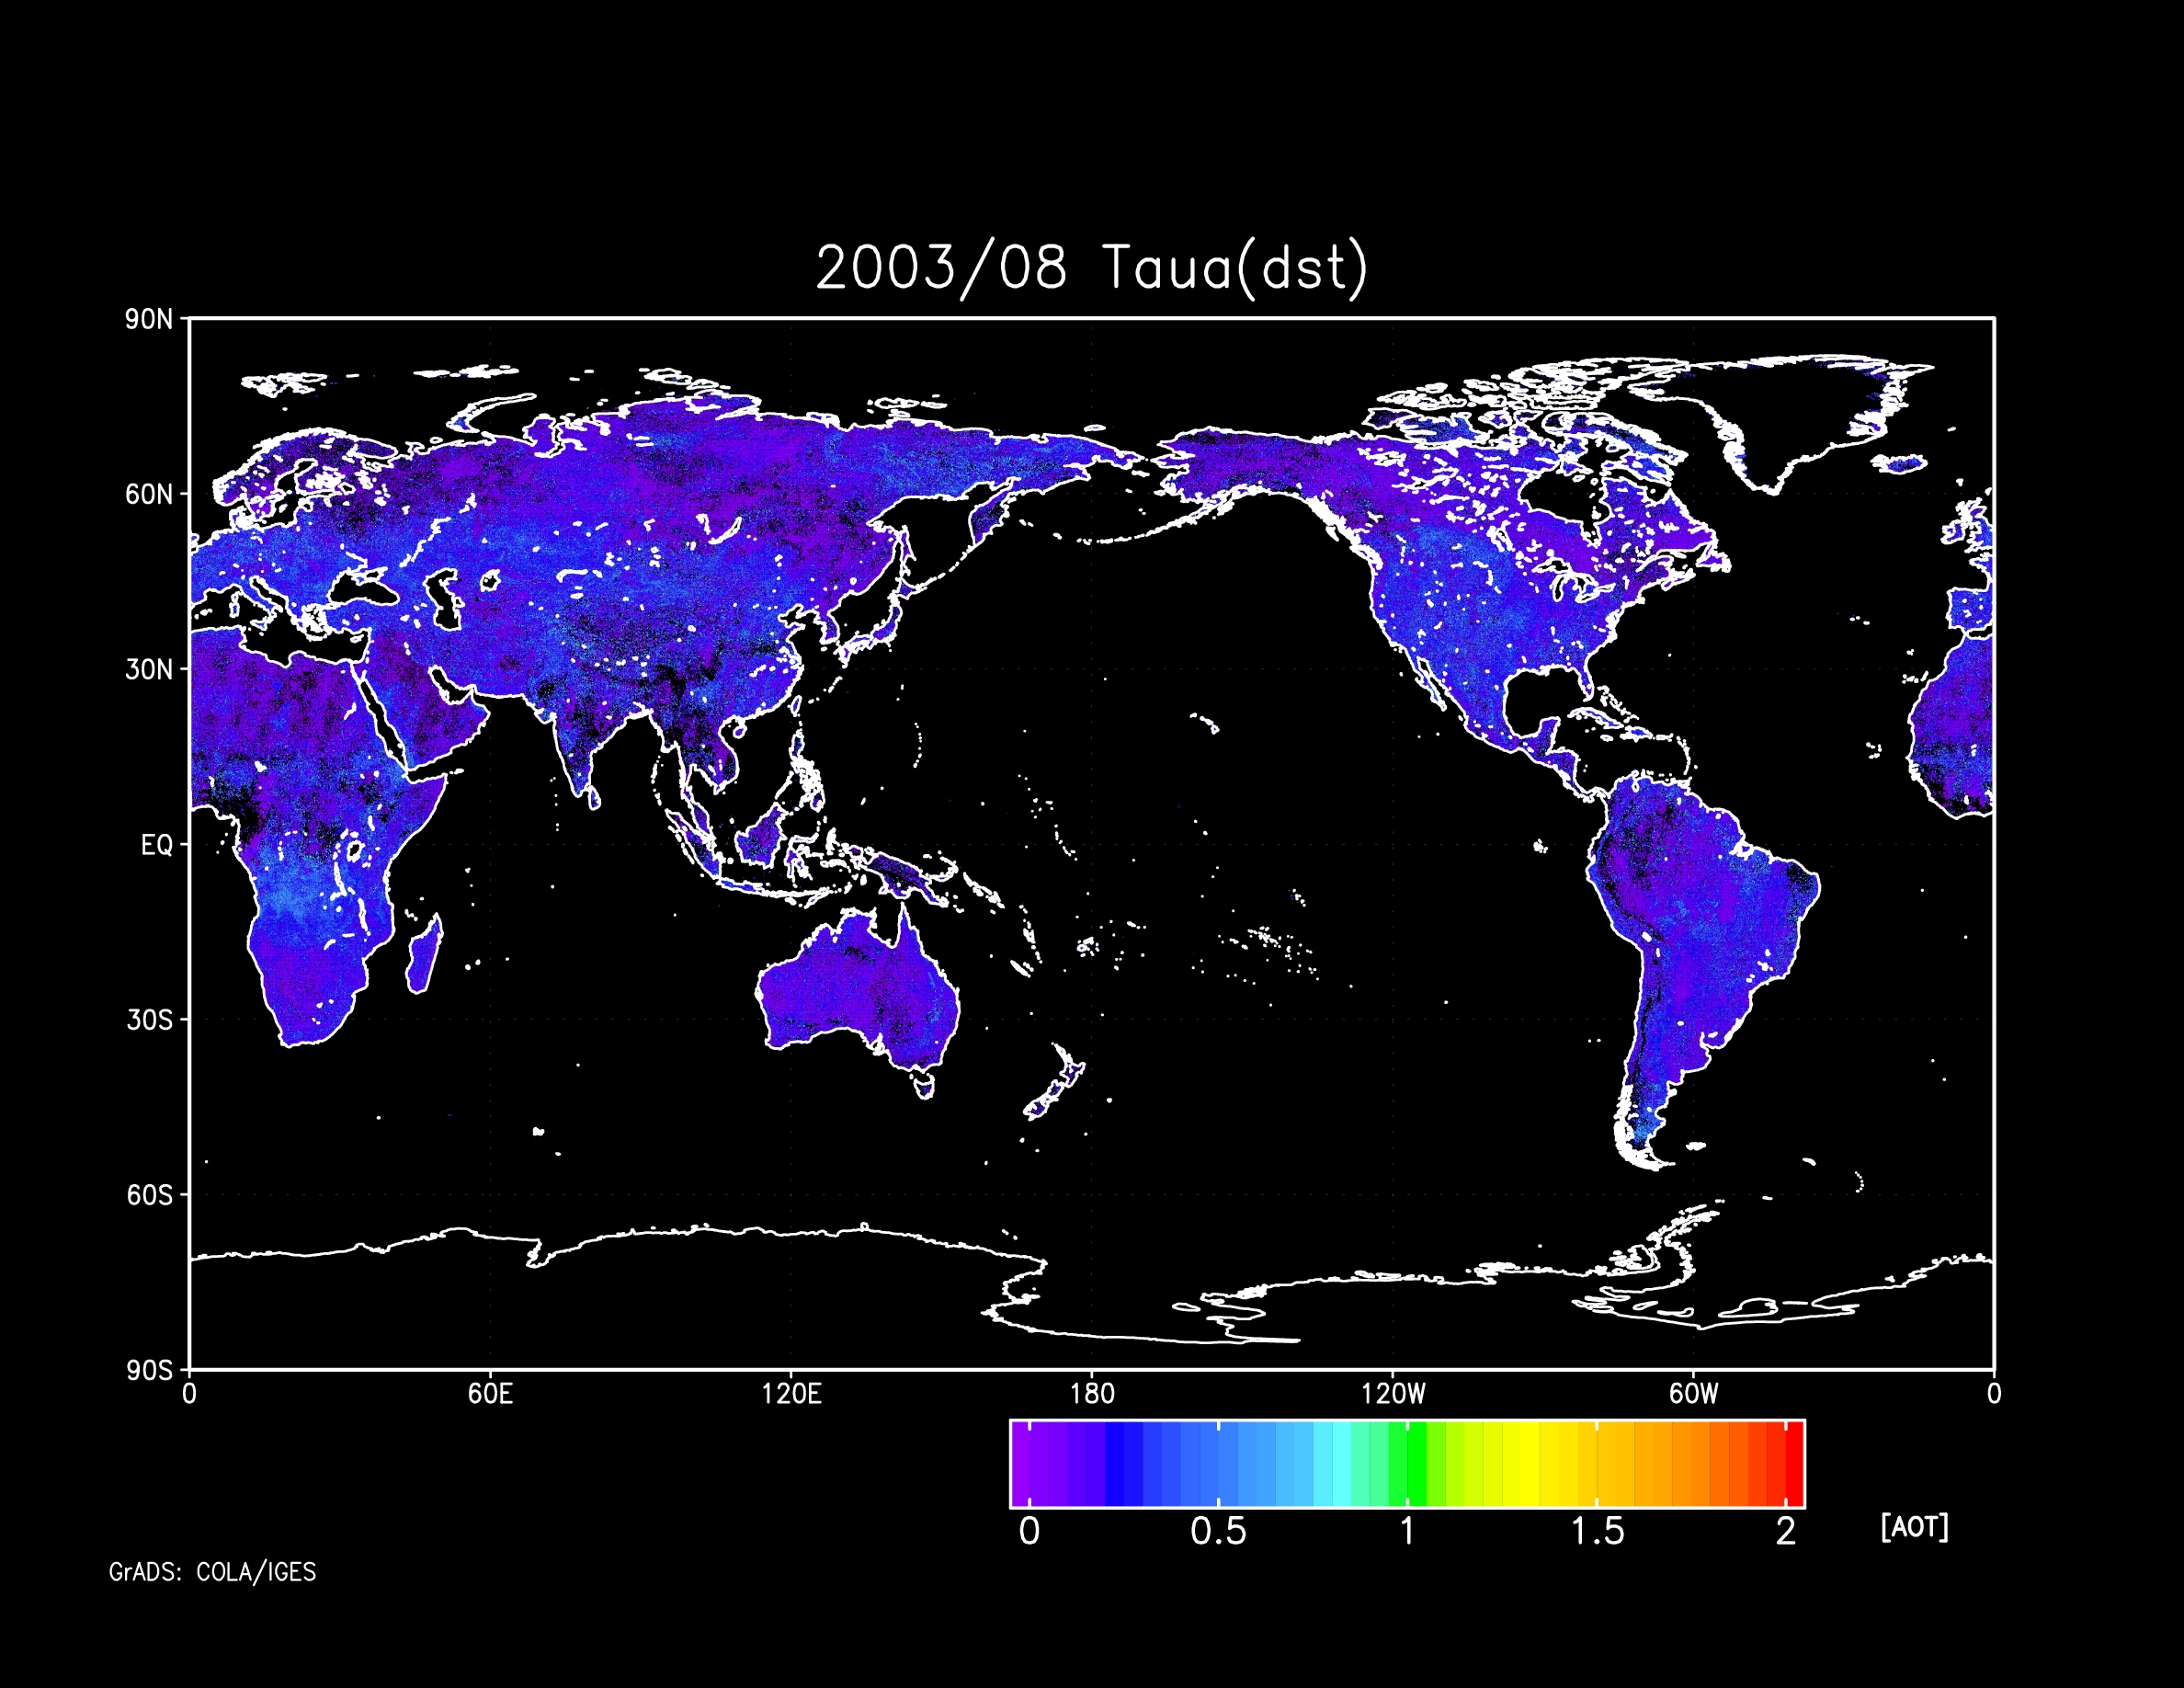
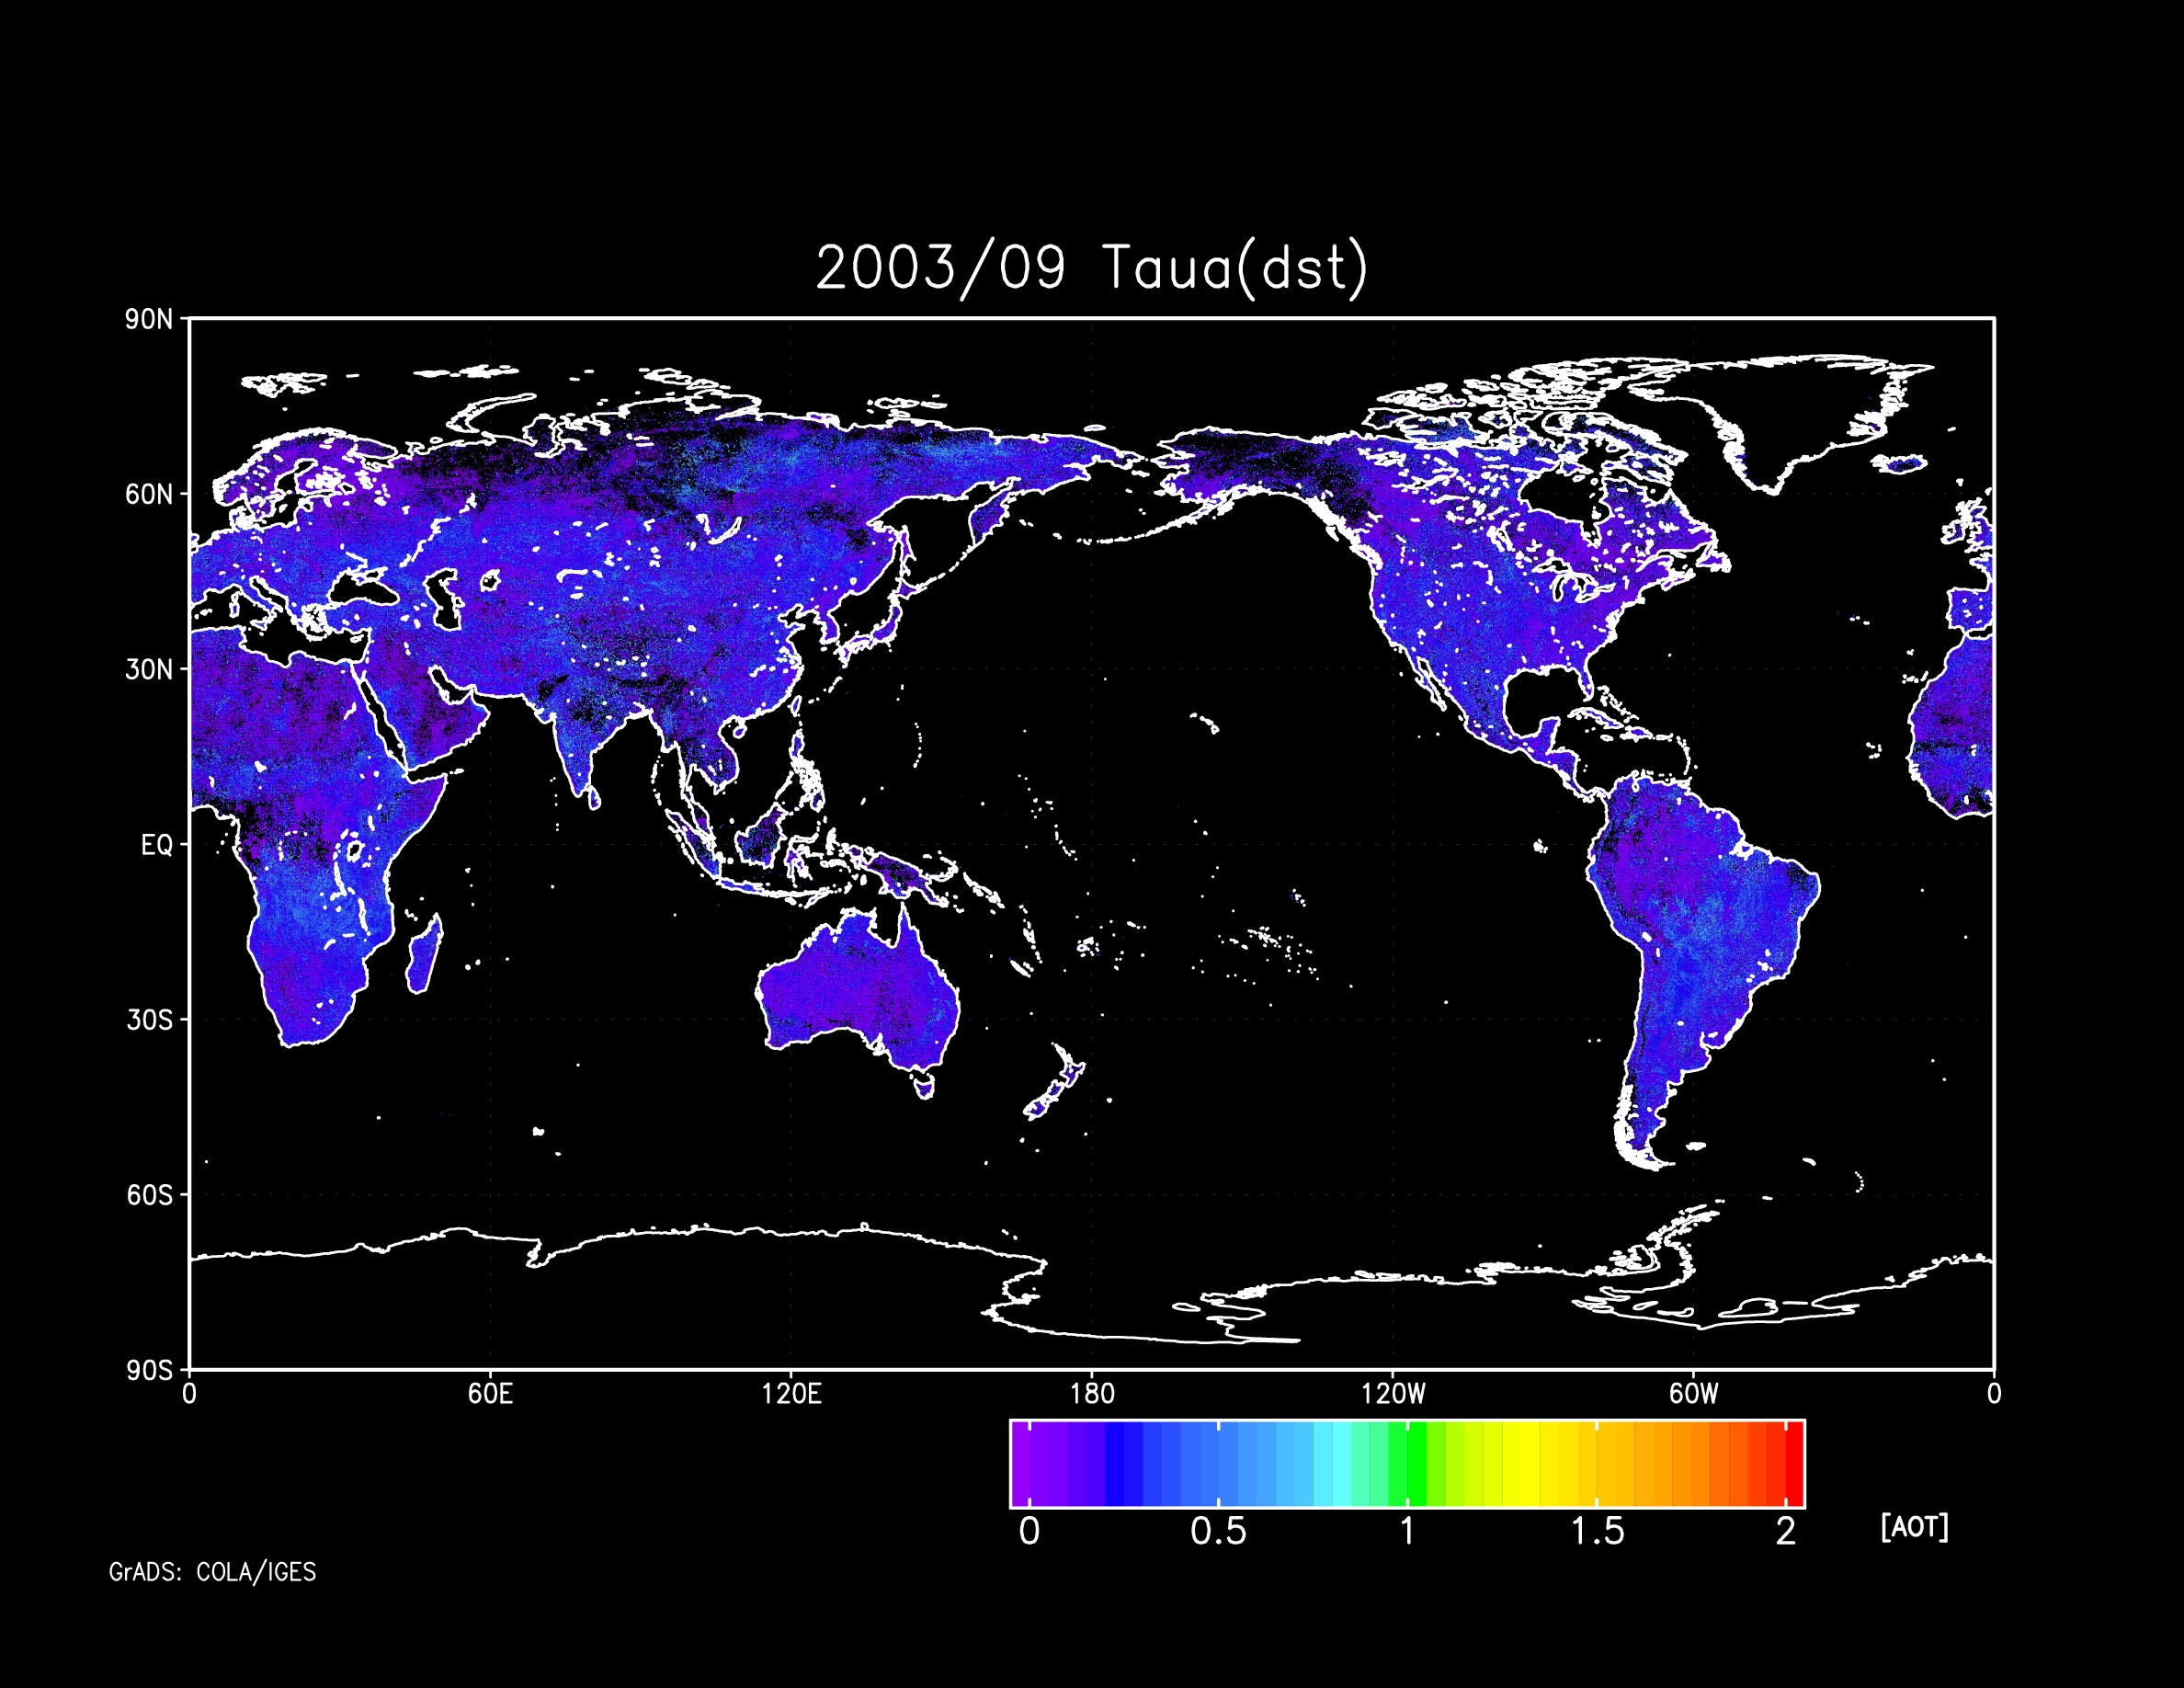
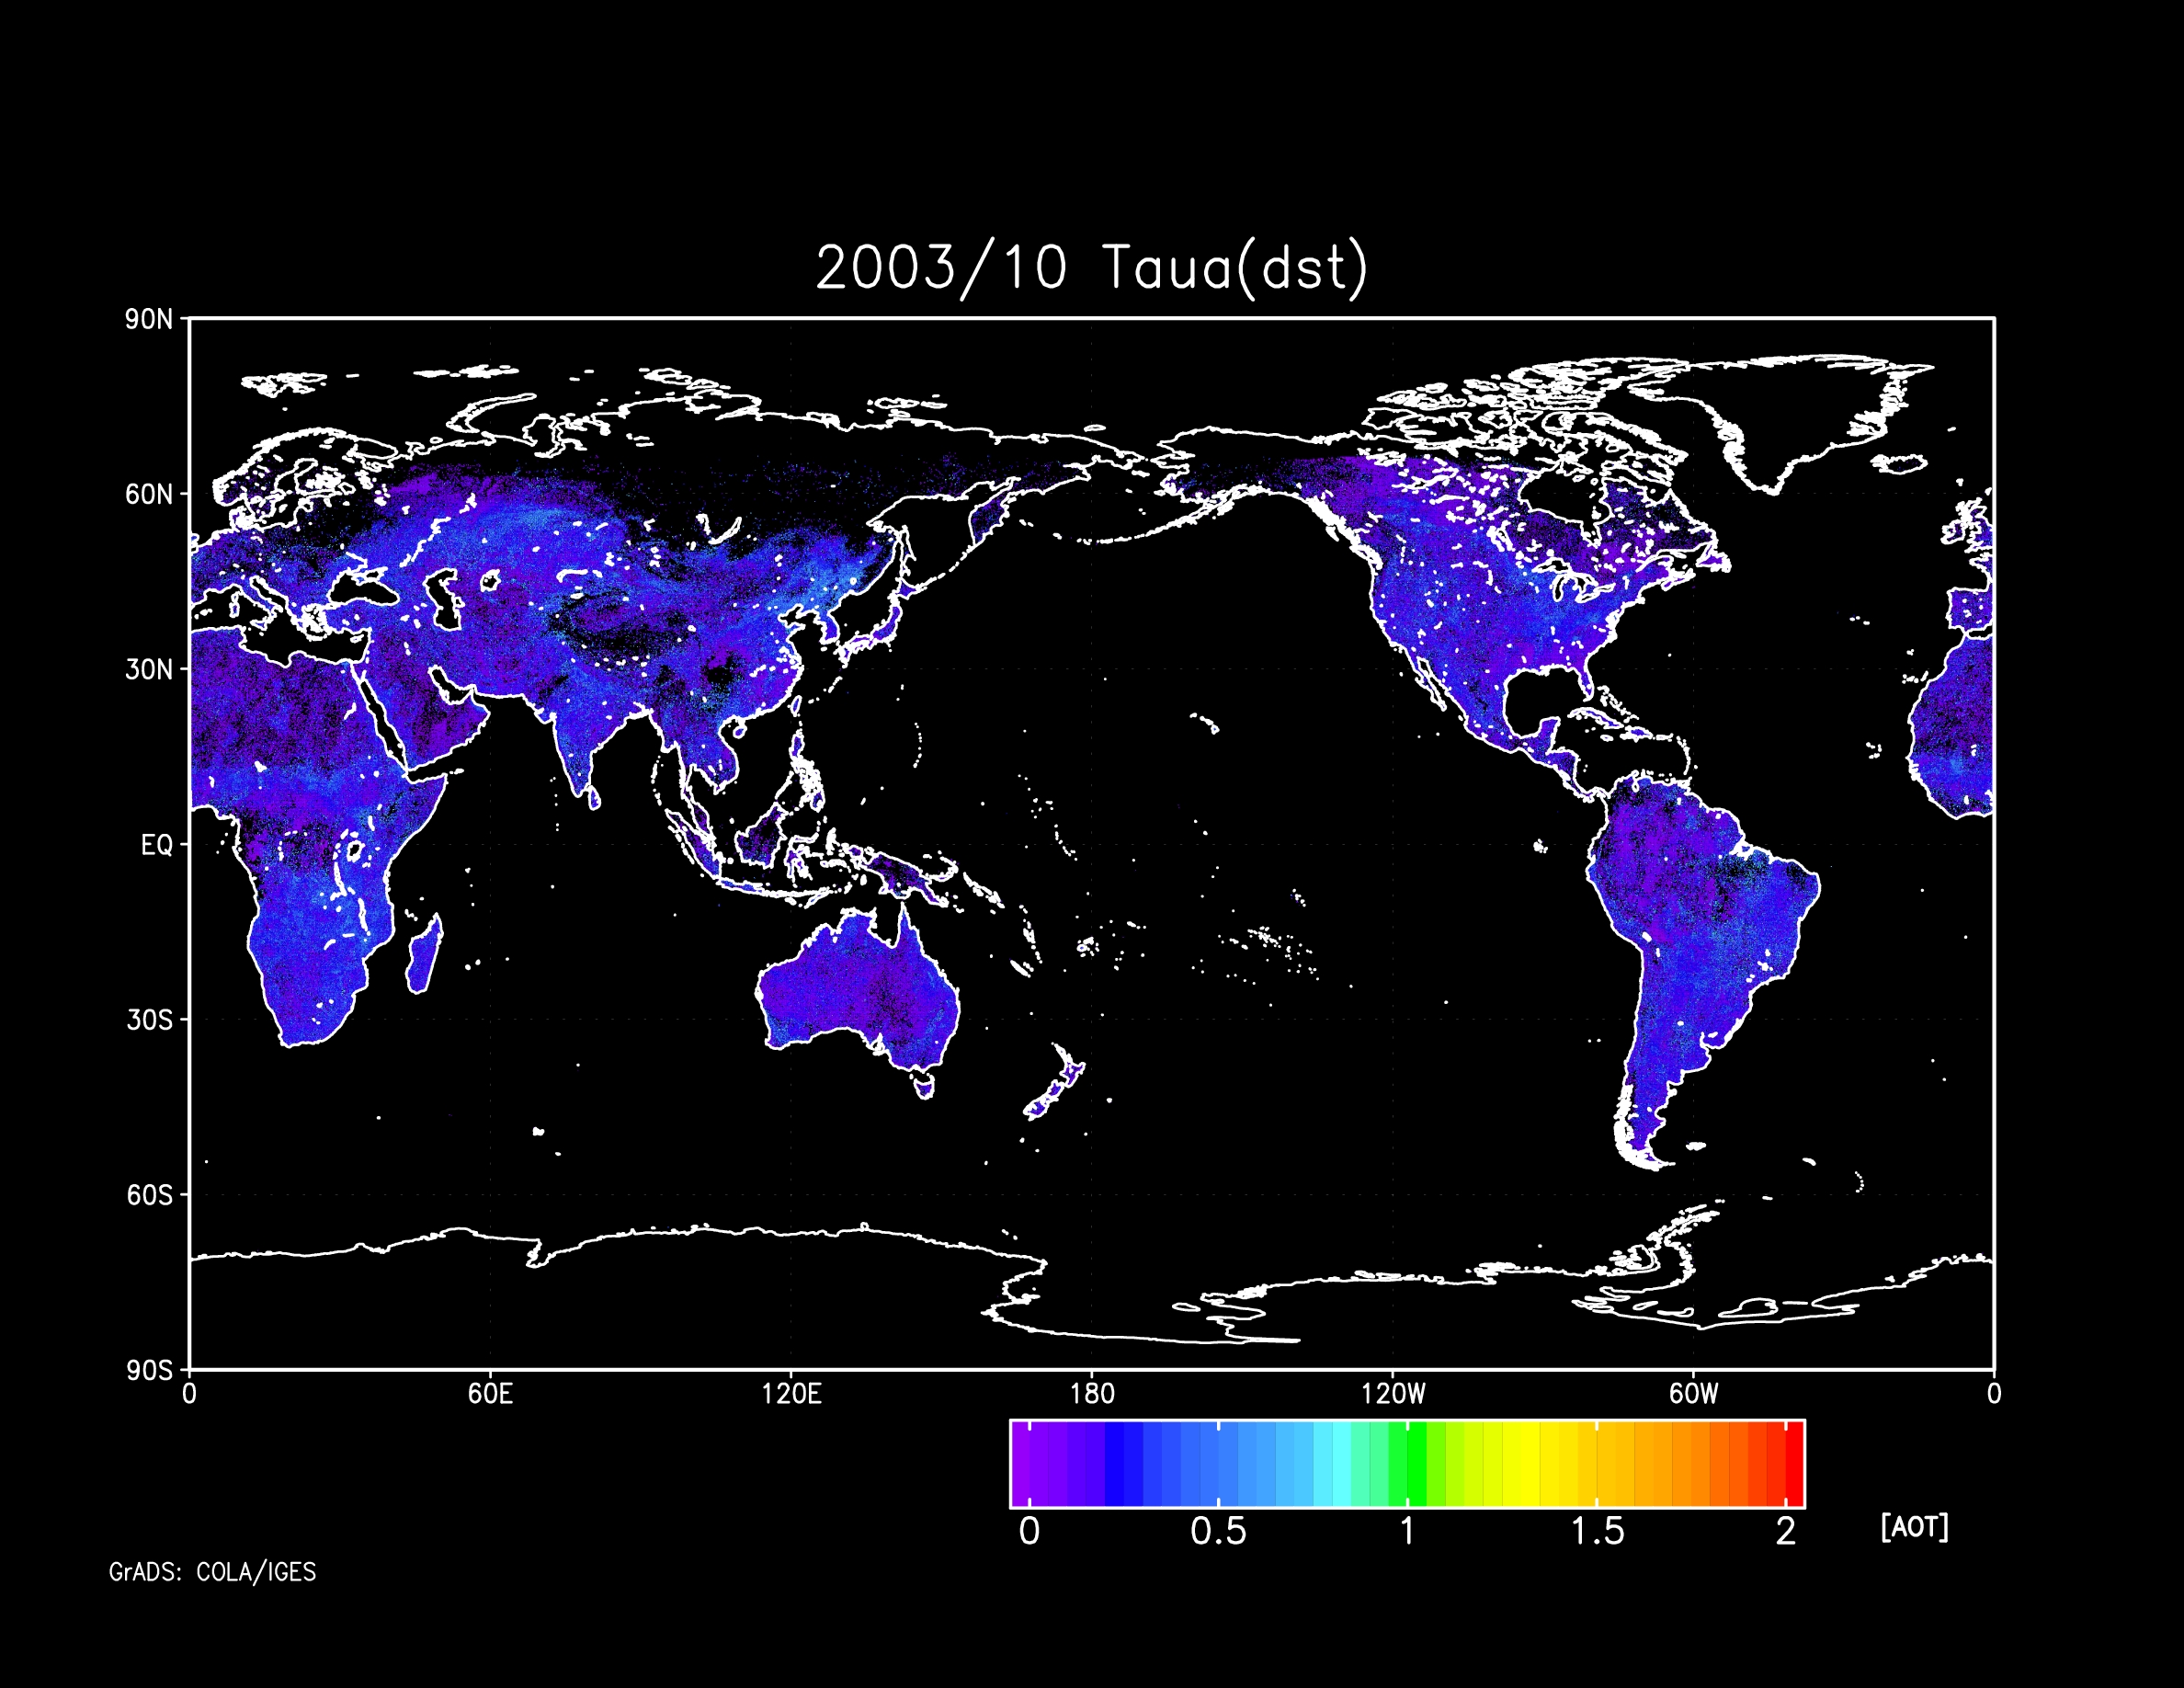
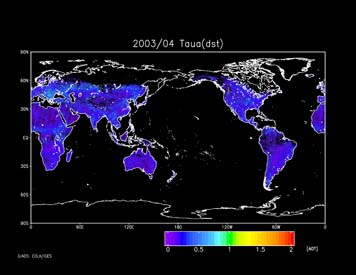
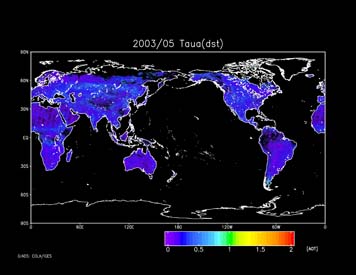
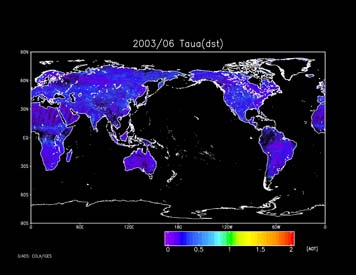
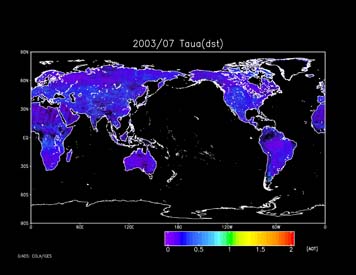
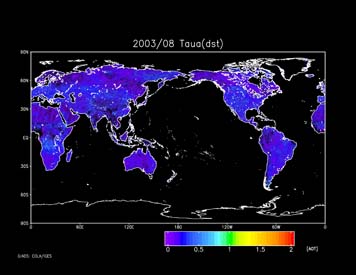
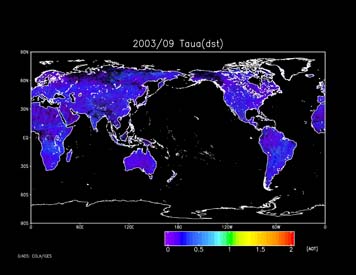
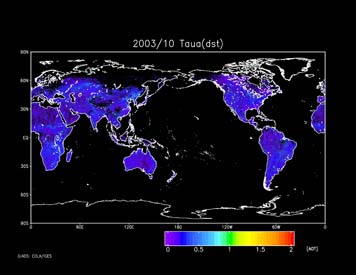
Taua-dst (optical thickness of dust aerosol)
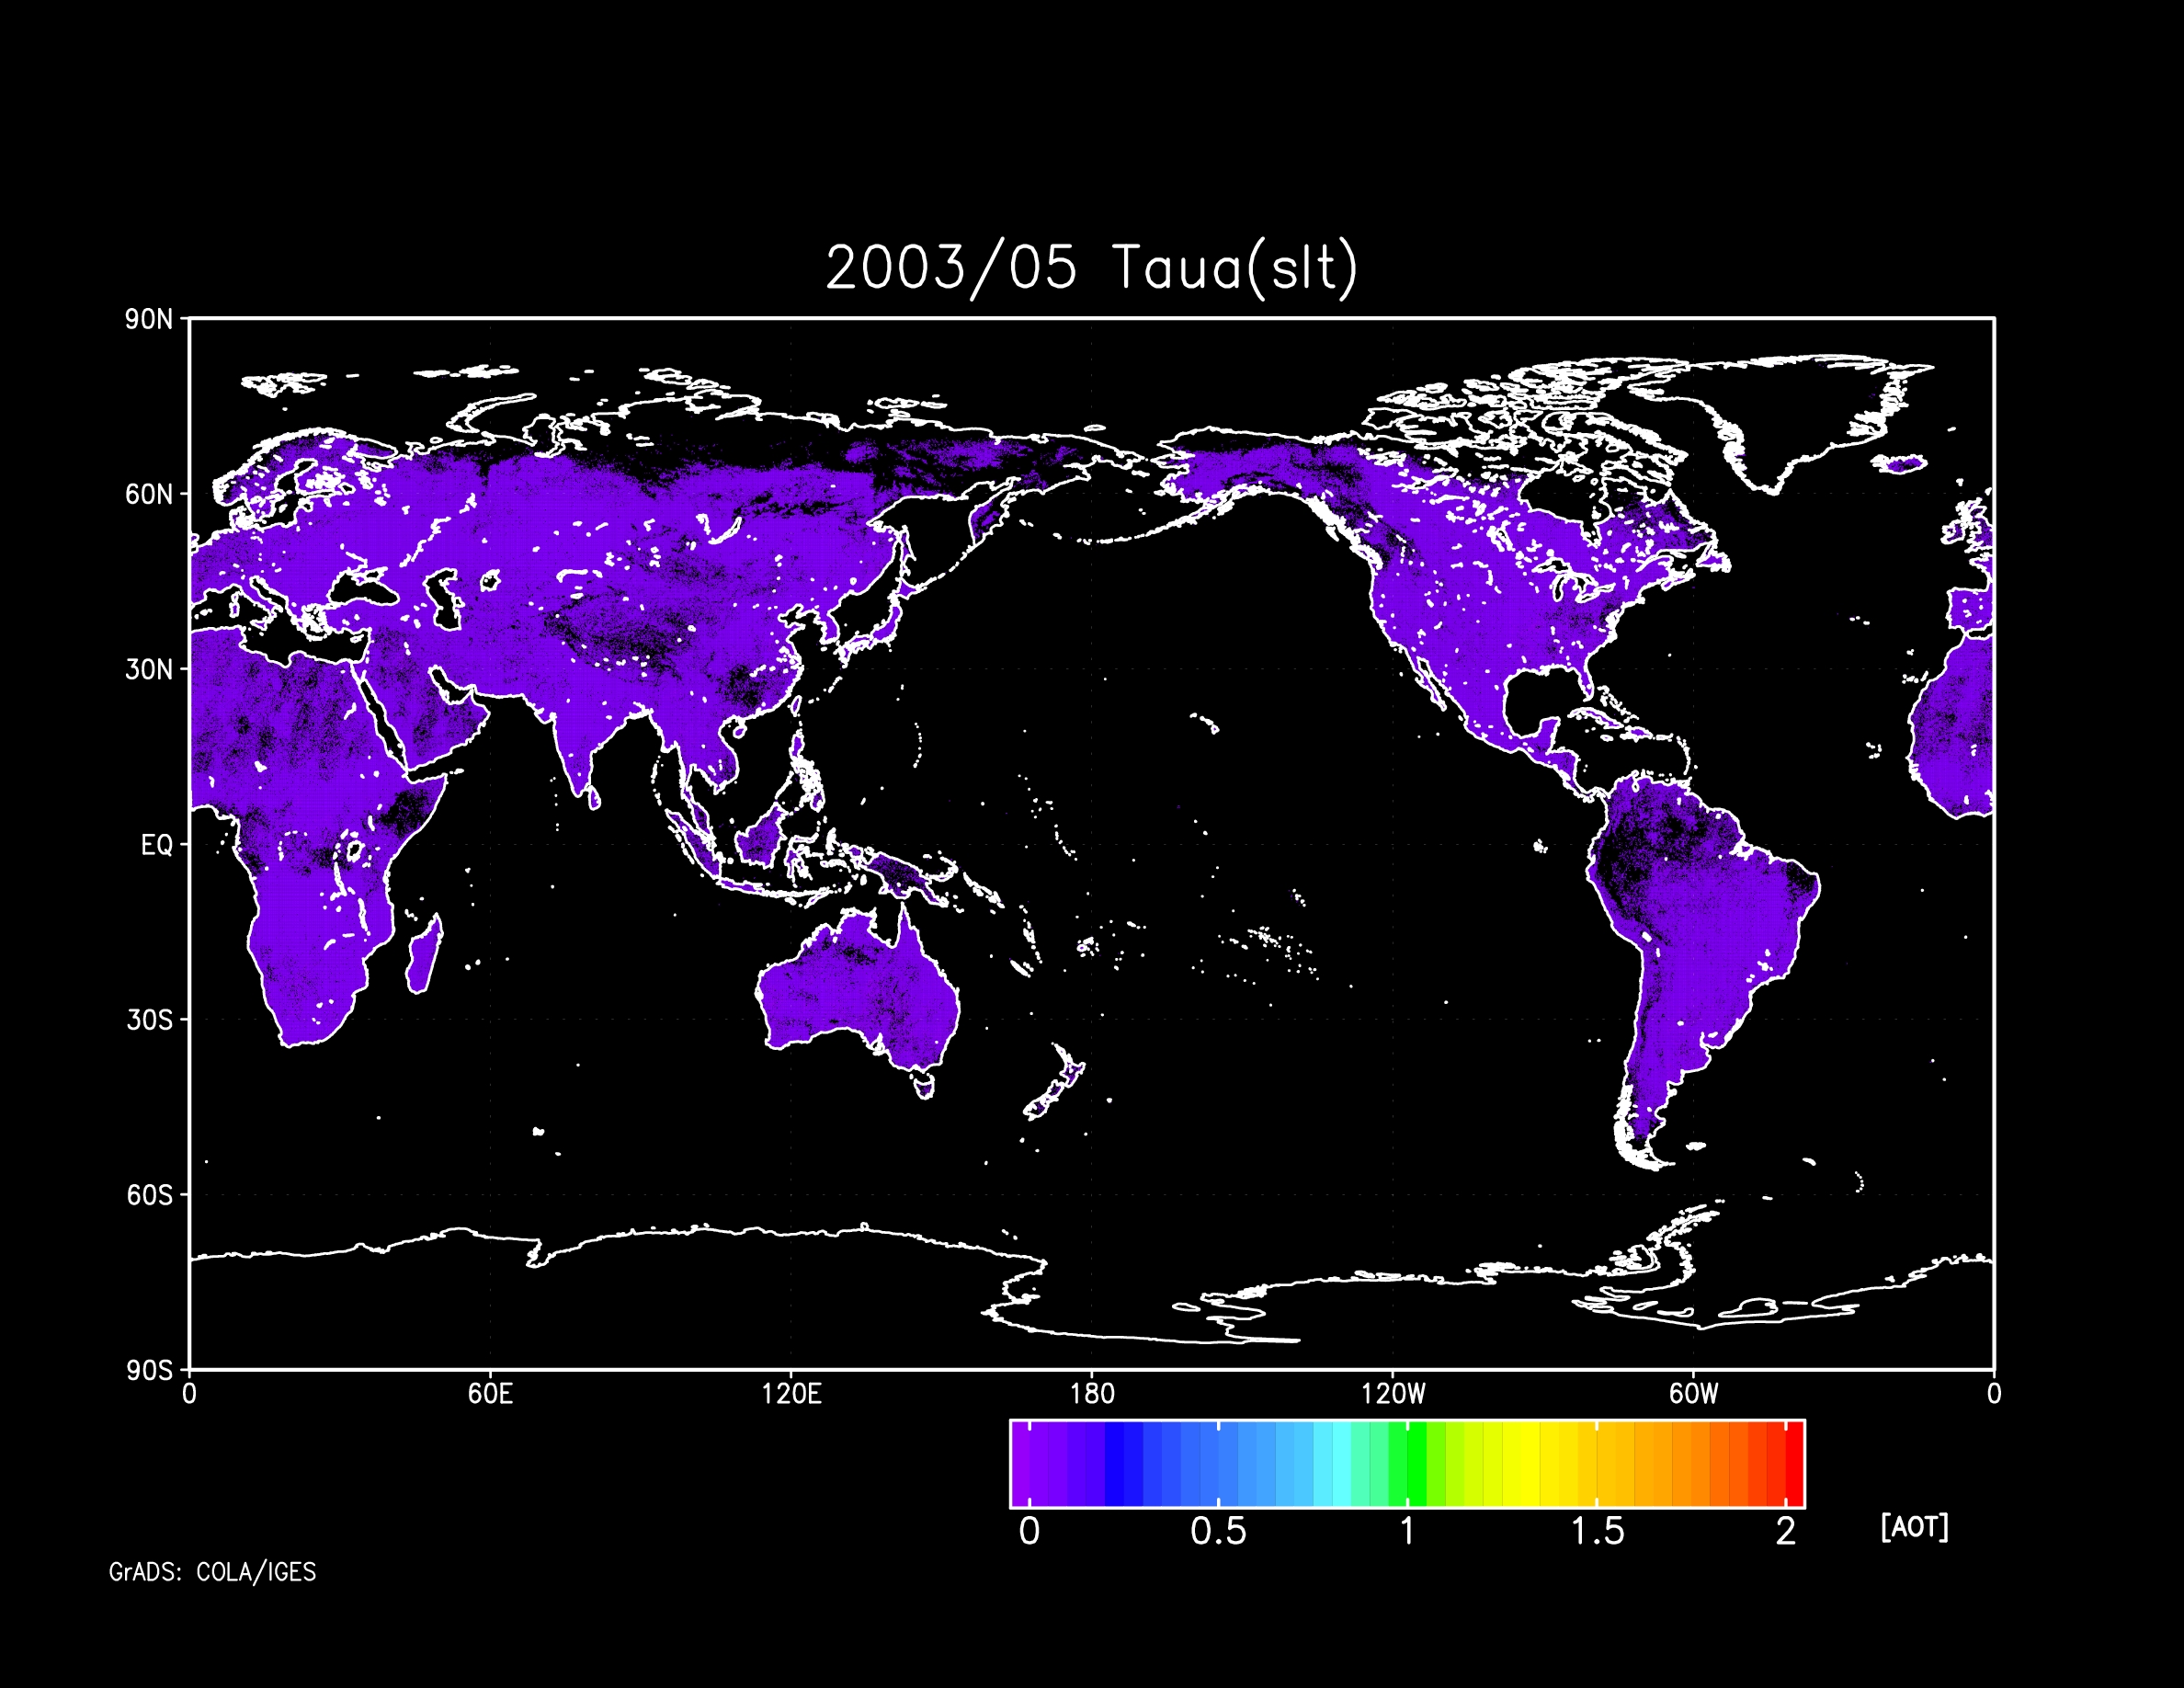
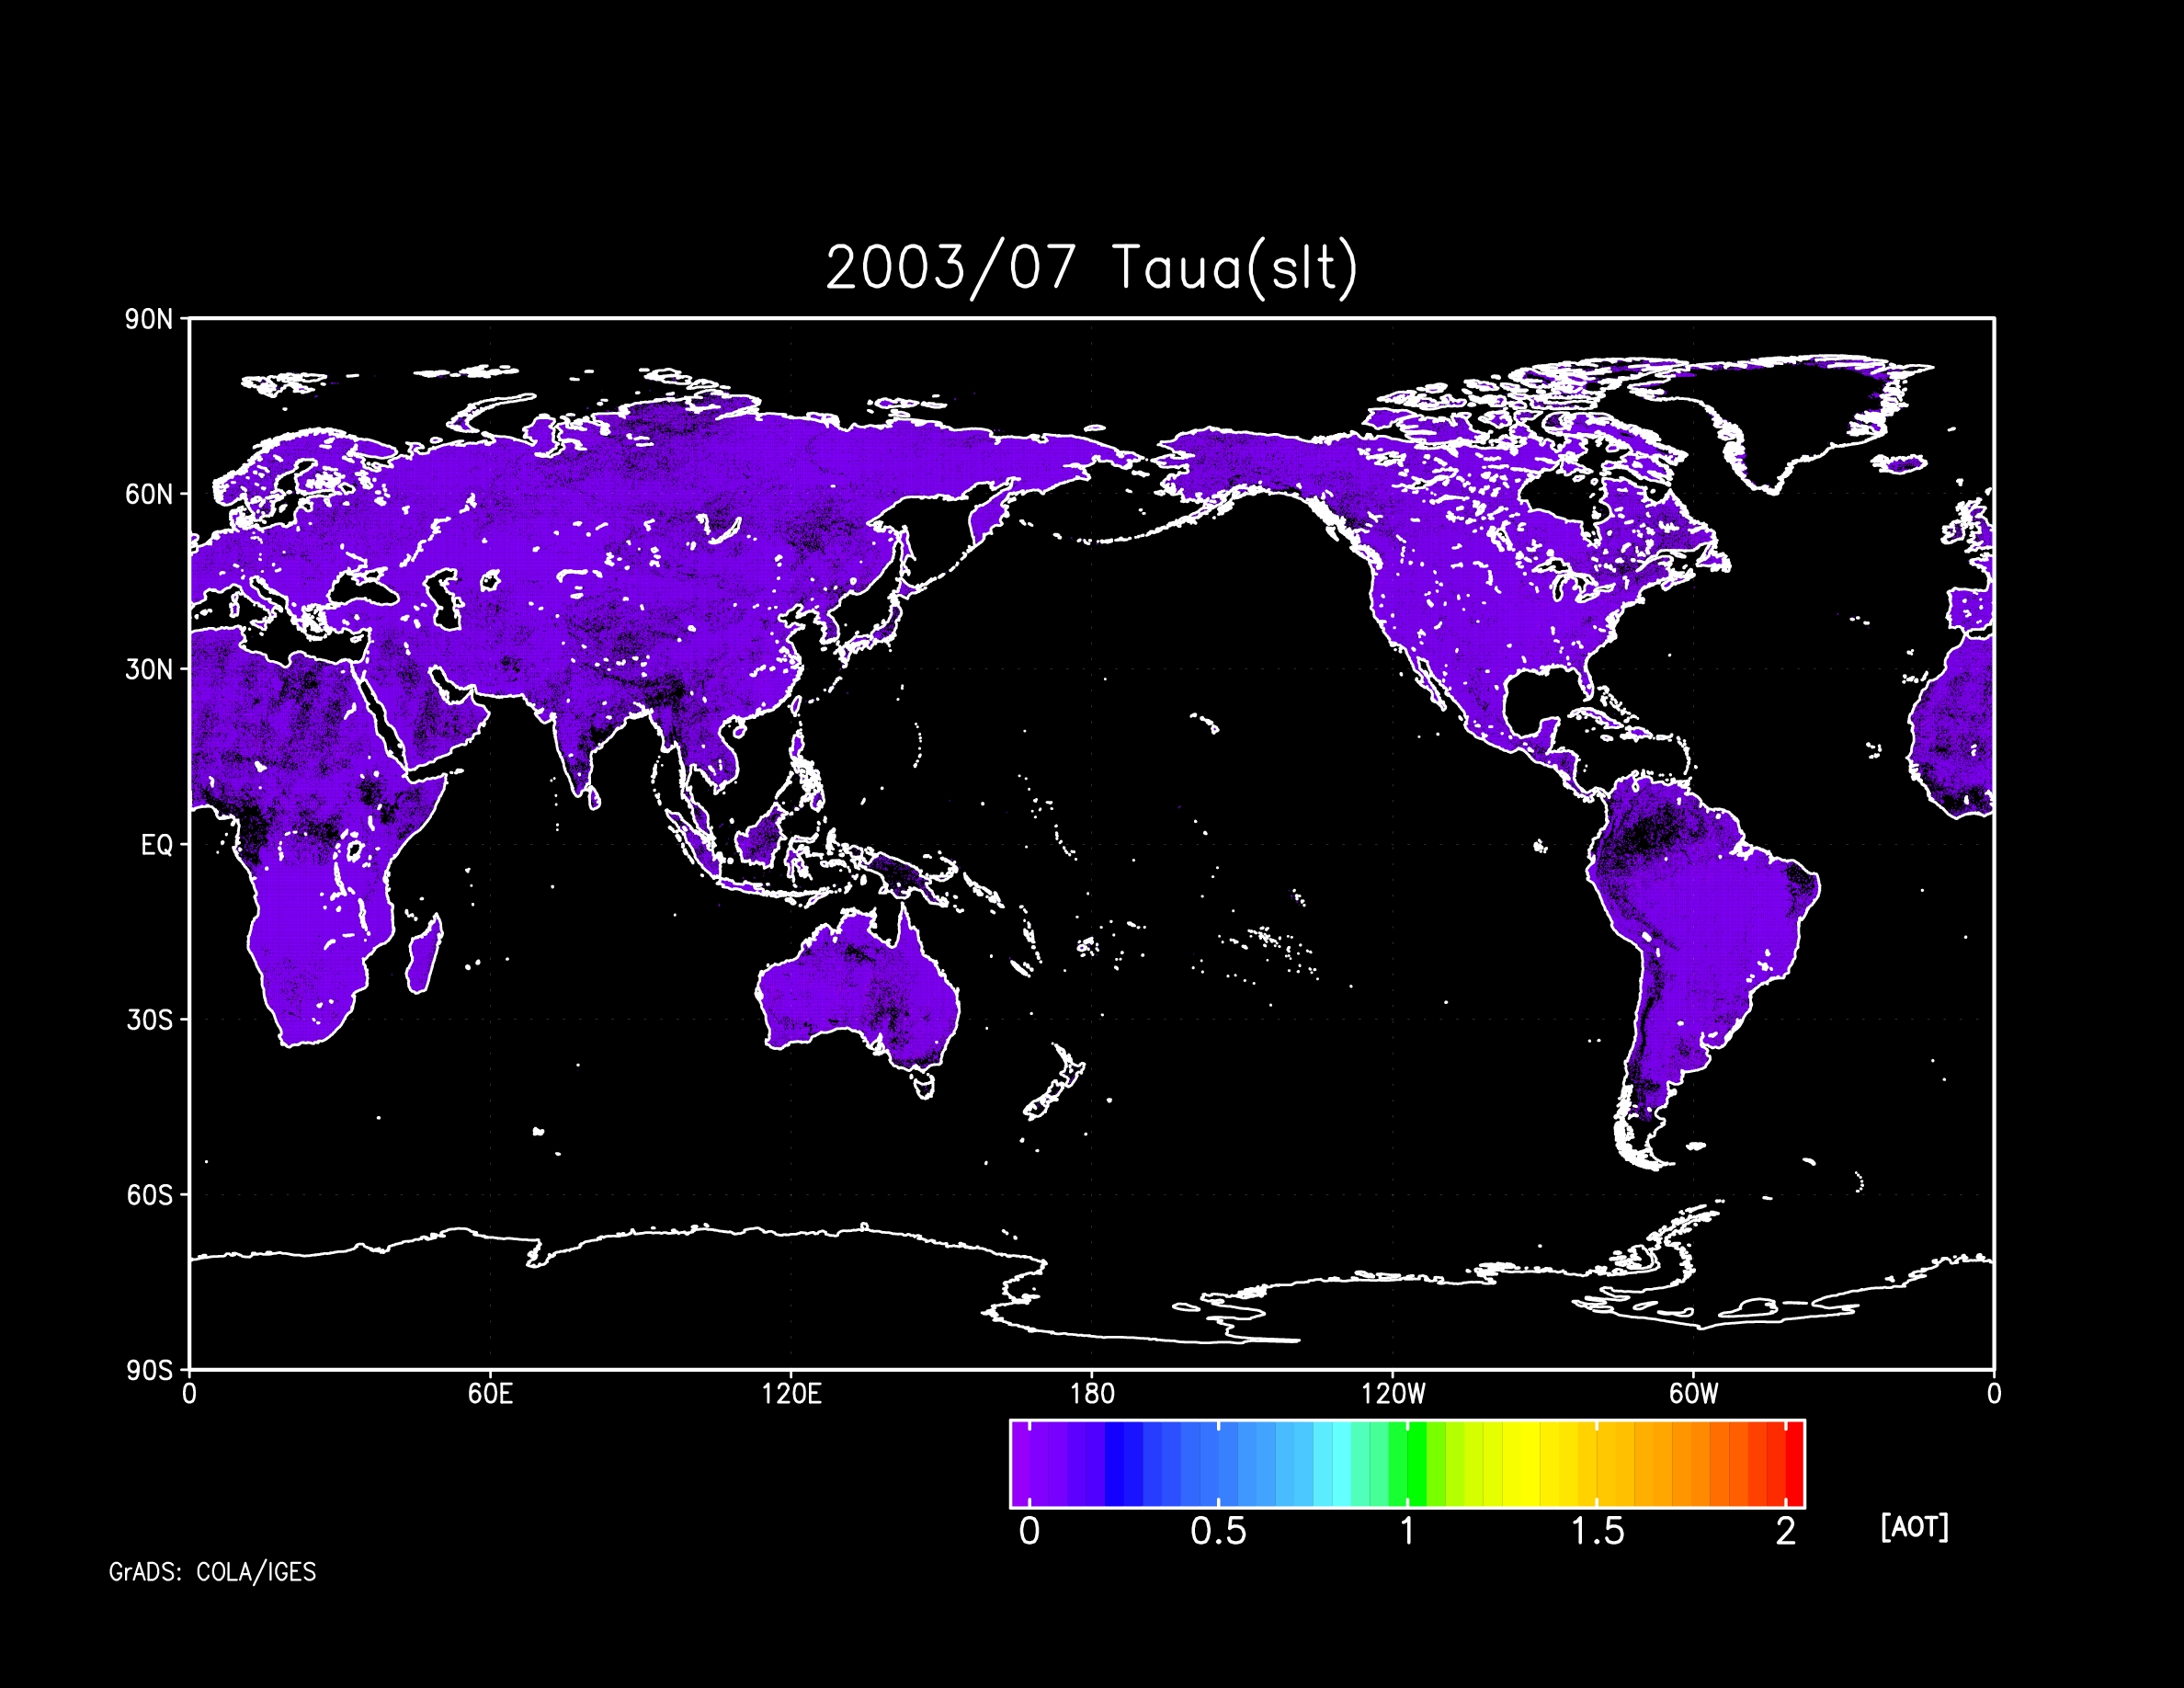
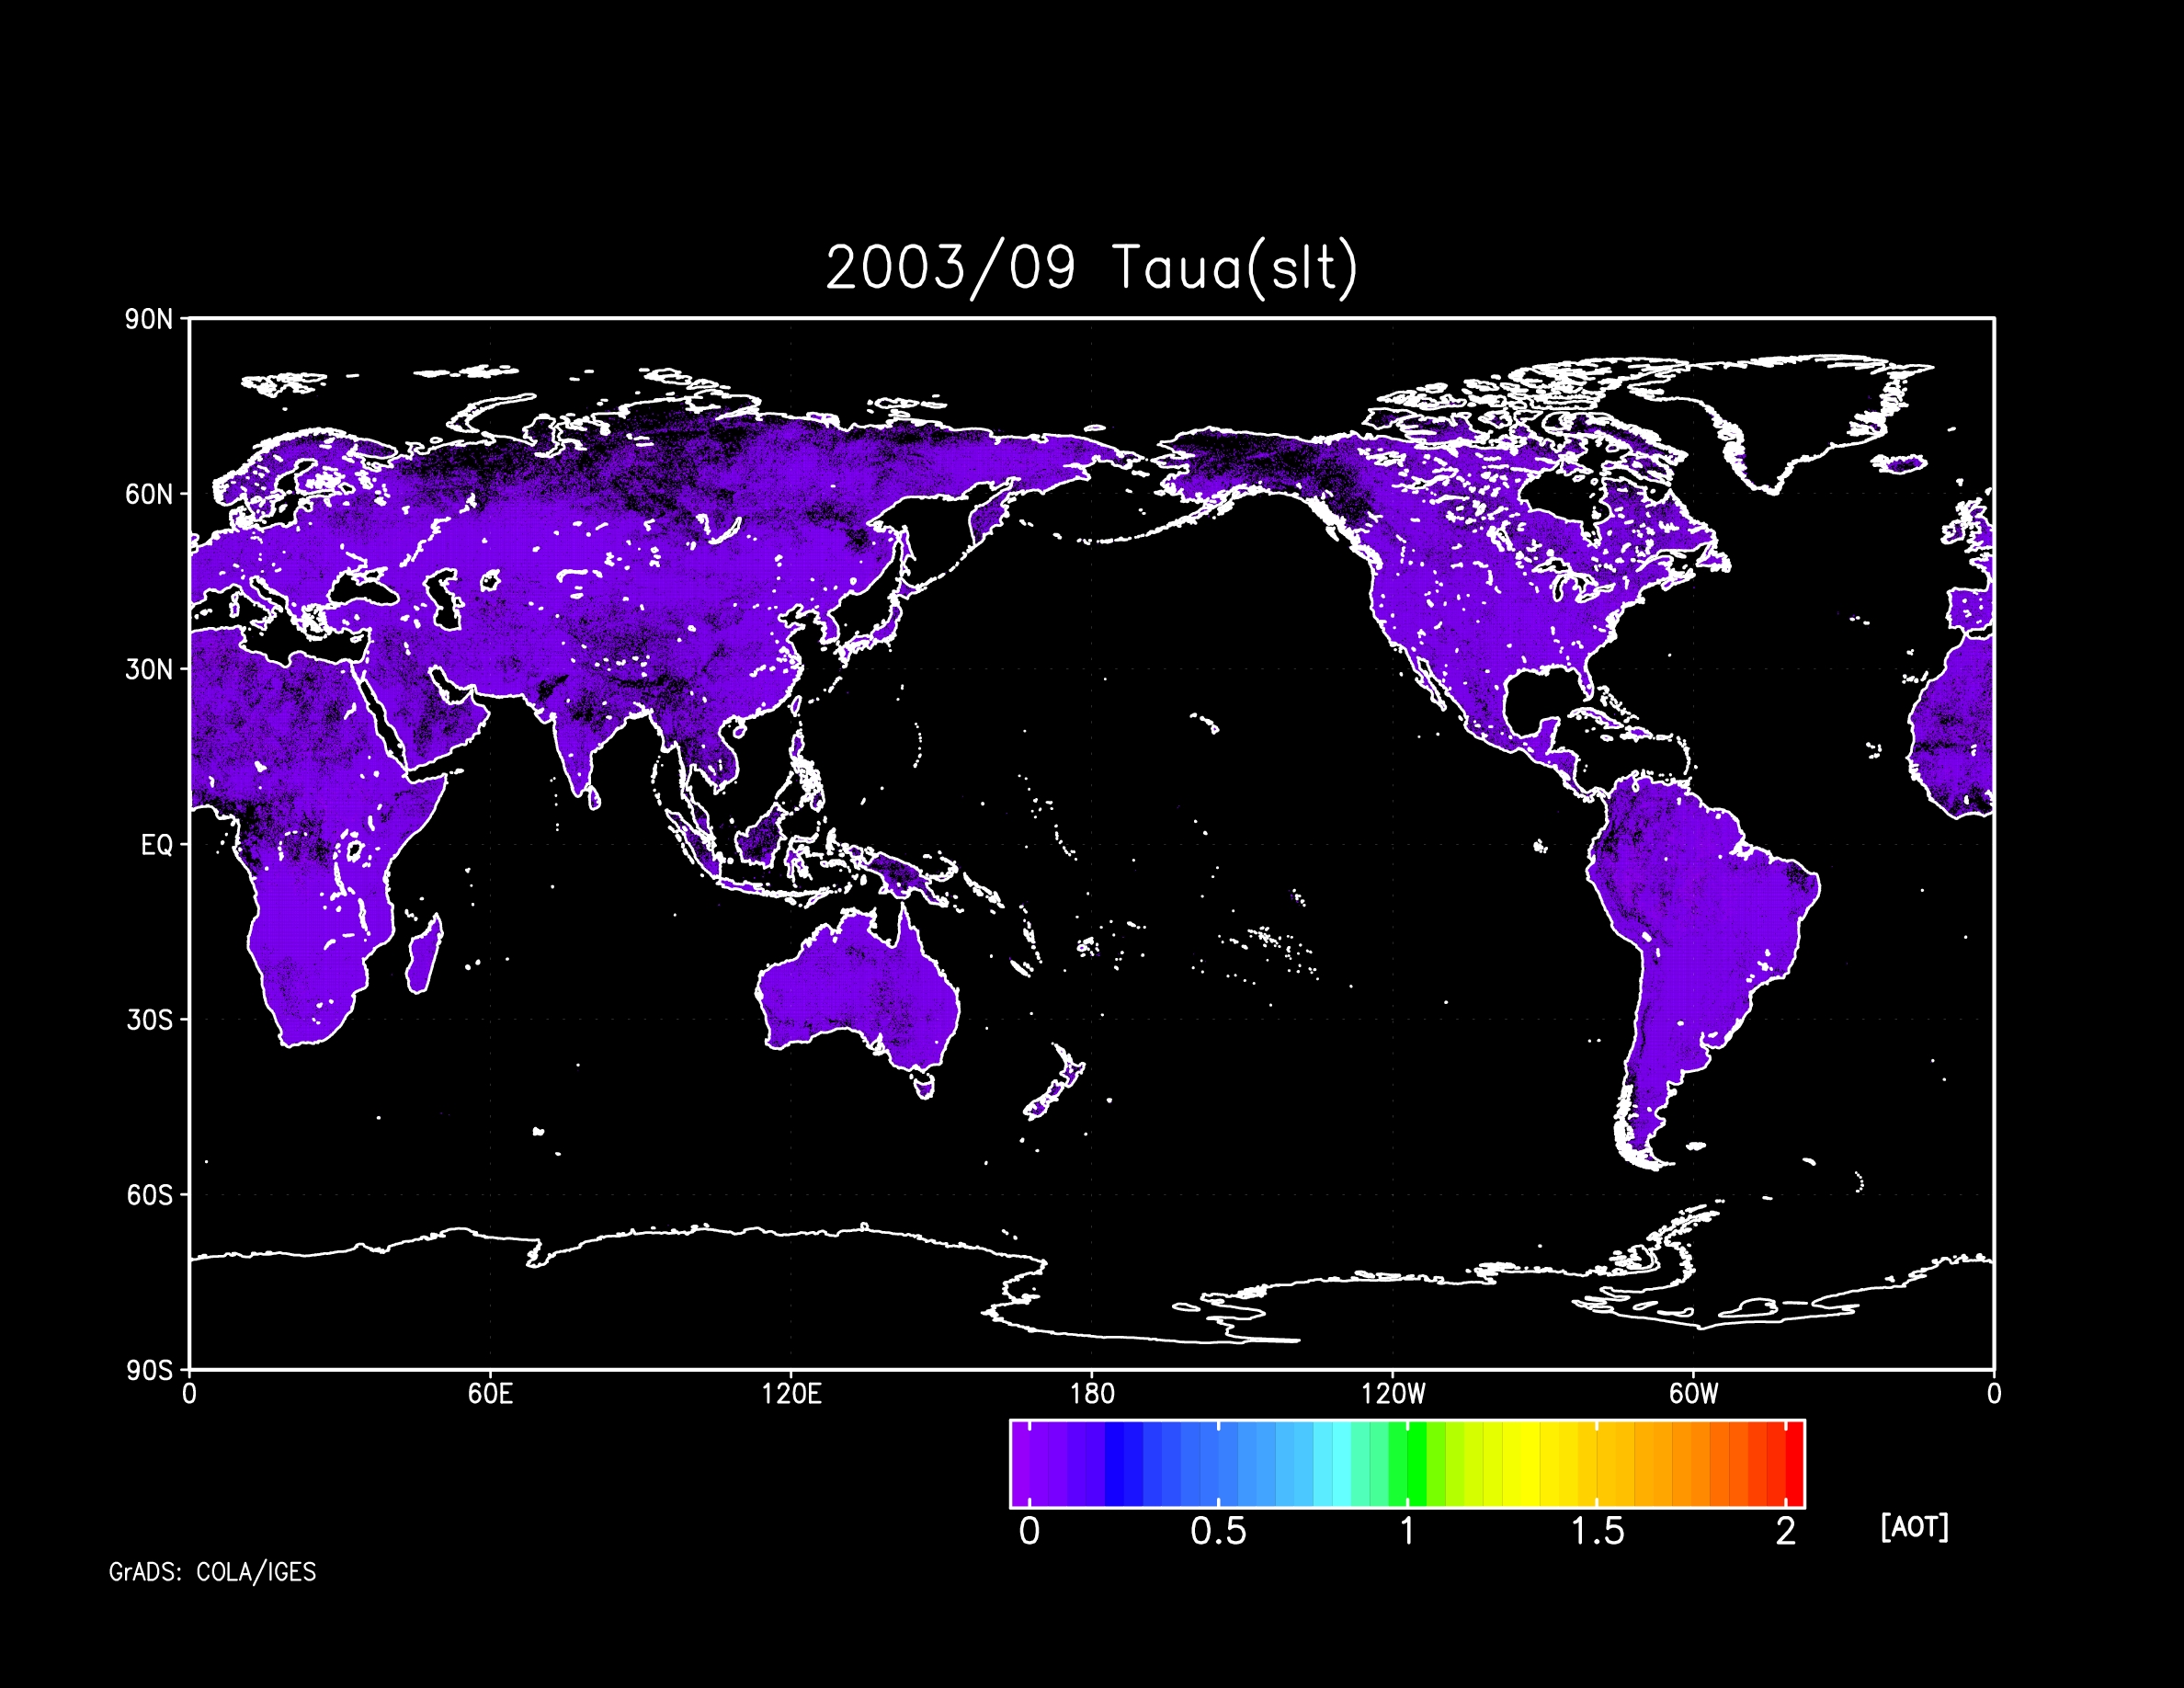
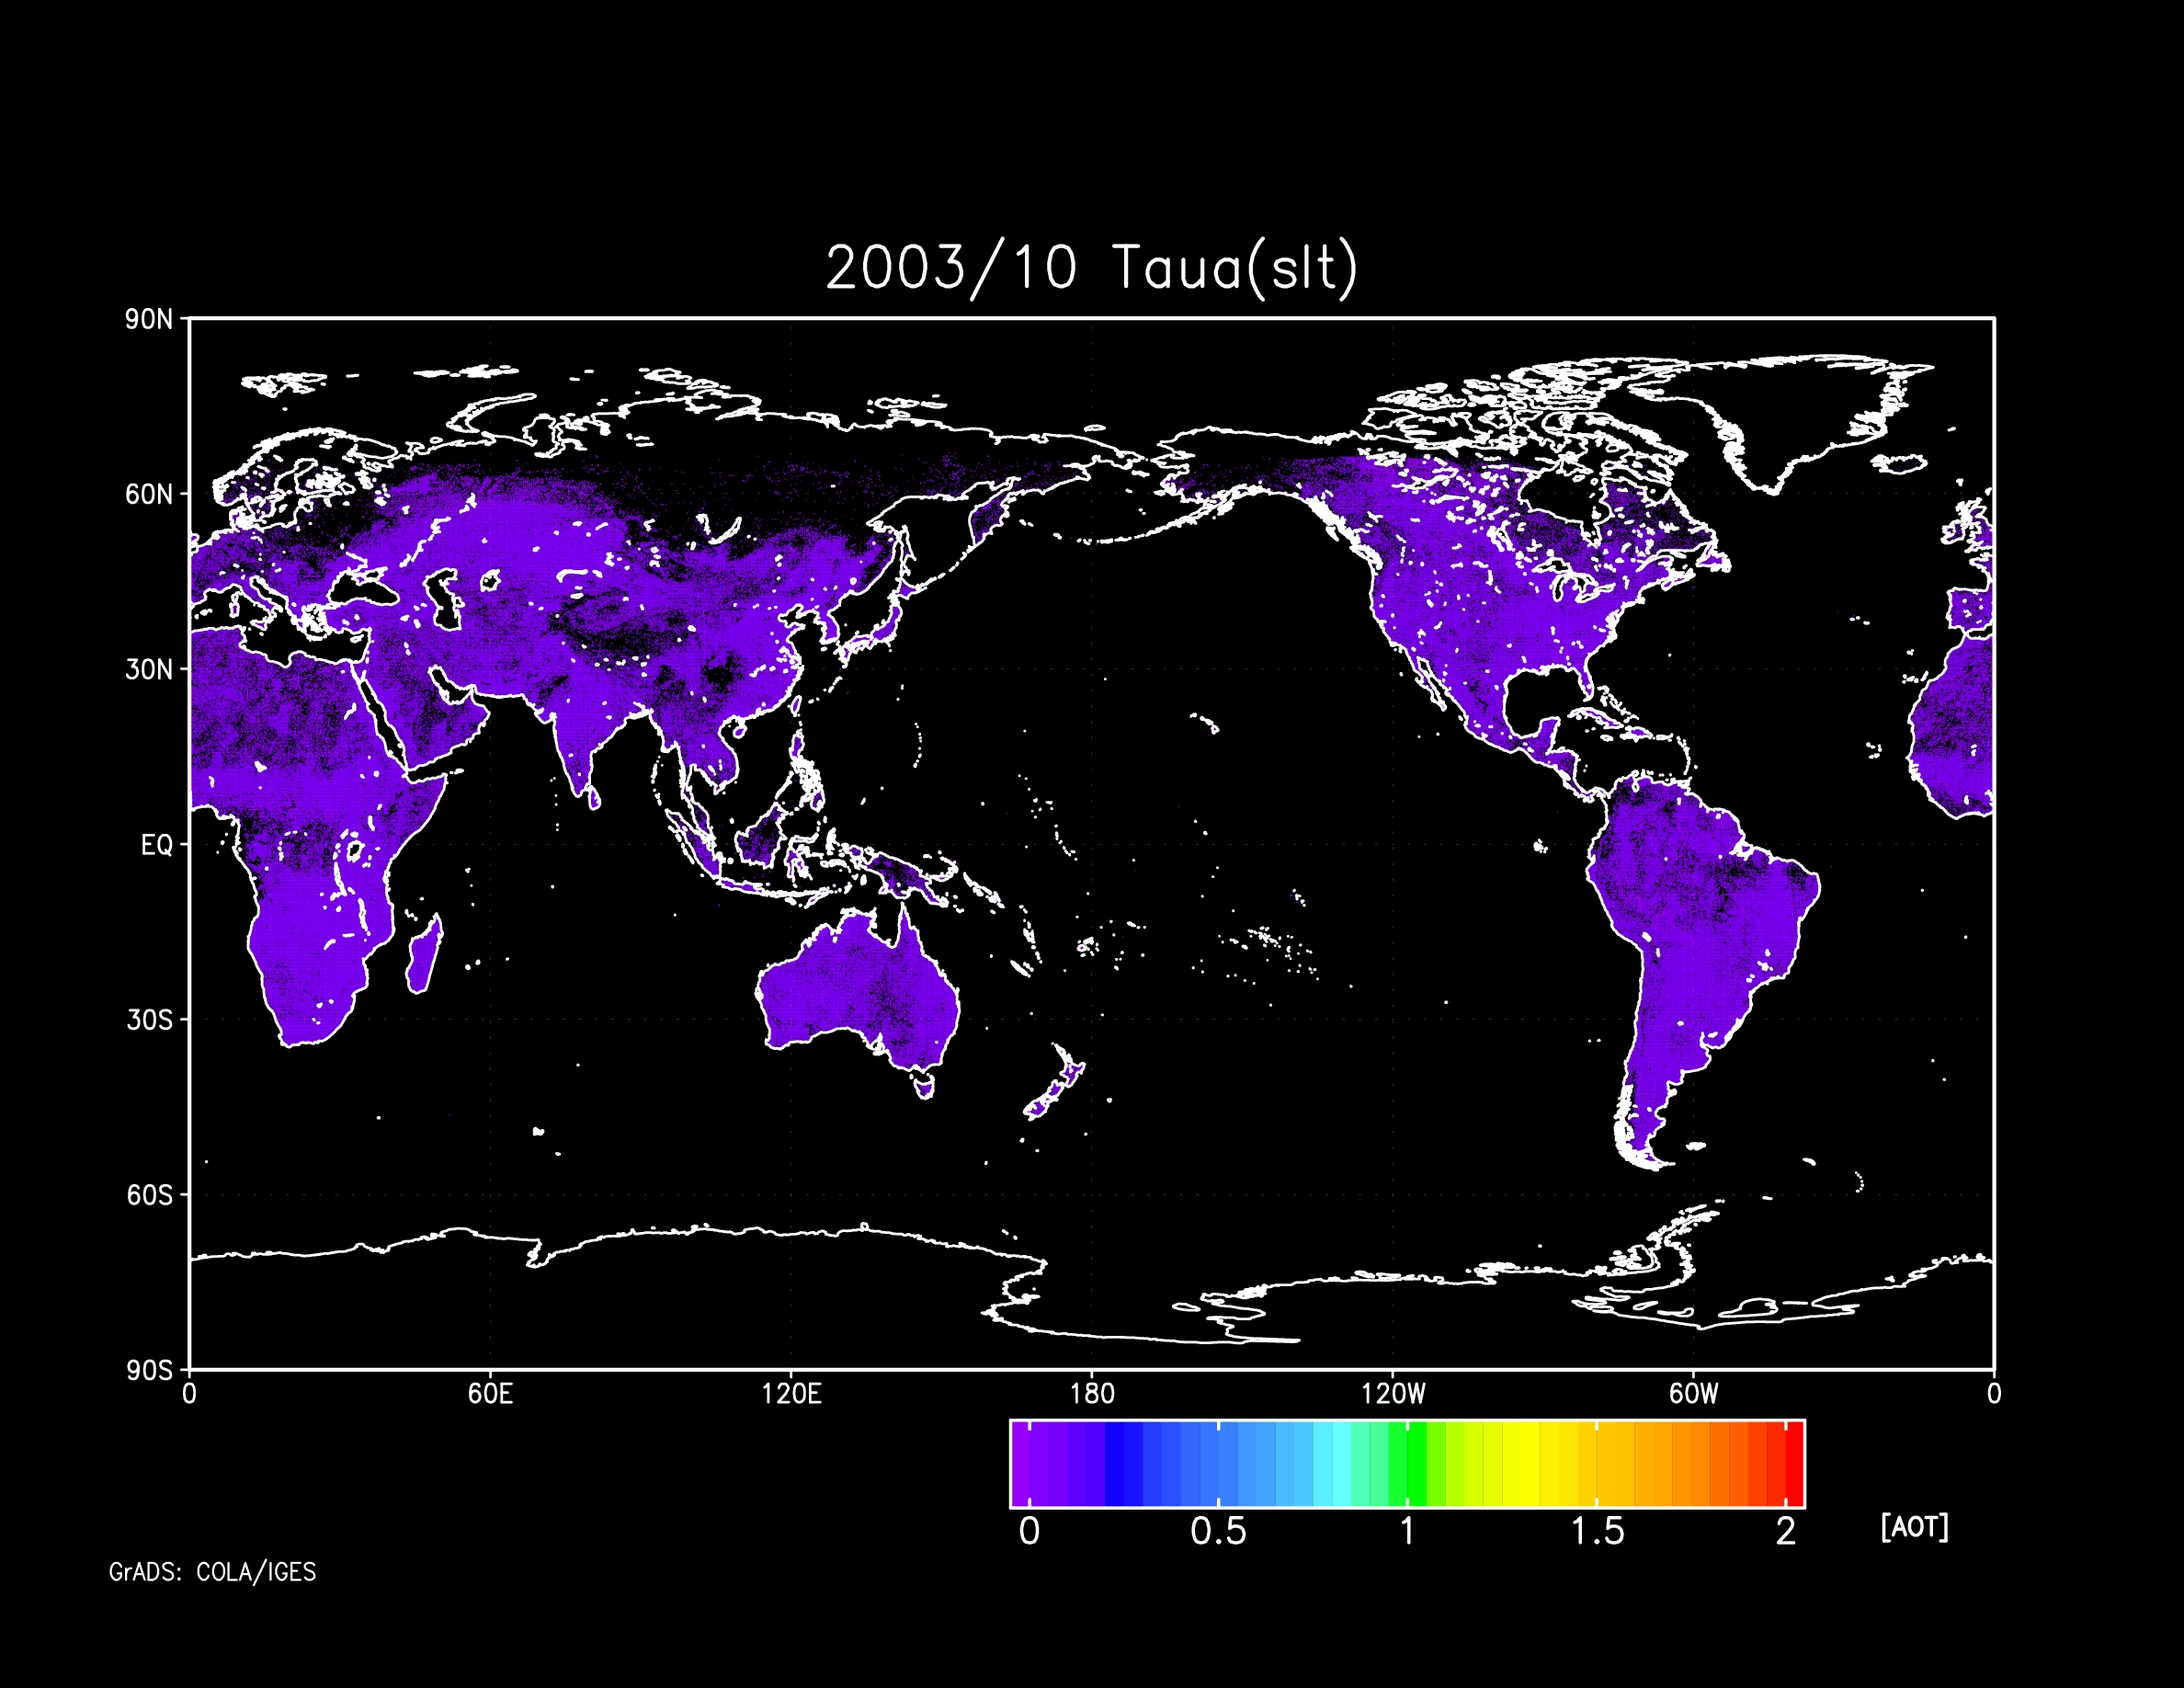
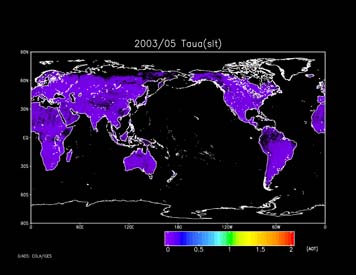
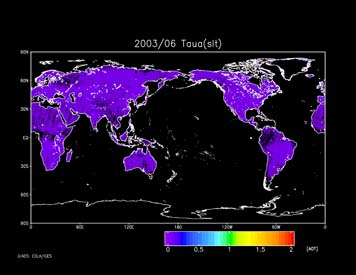
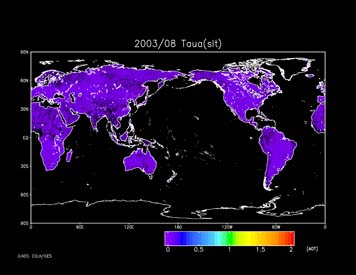
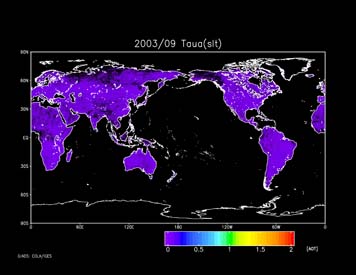
Taua-slt
(optical thickness of sea solt aerosol)
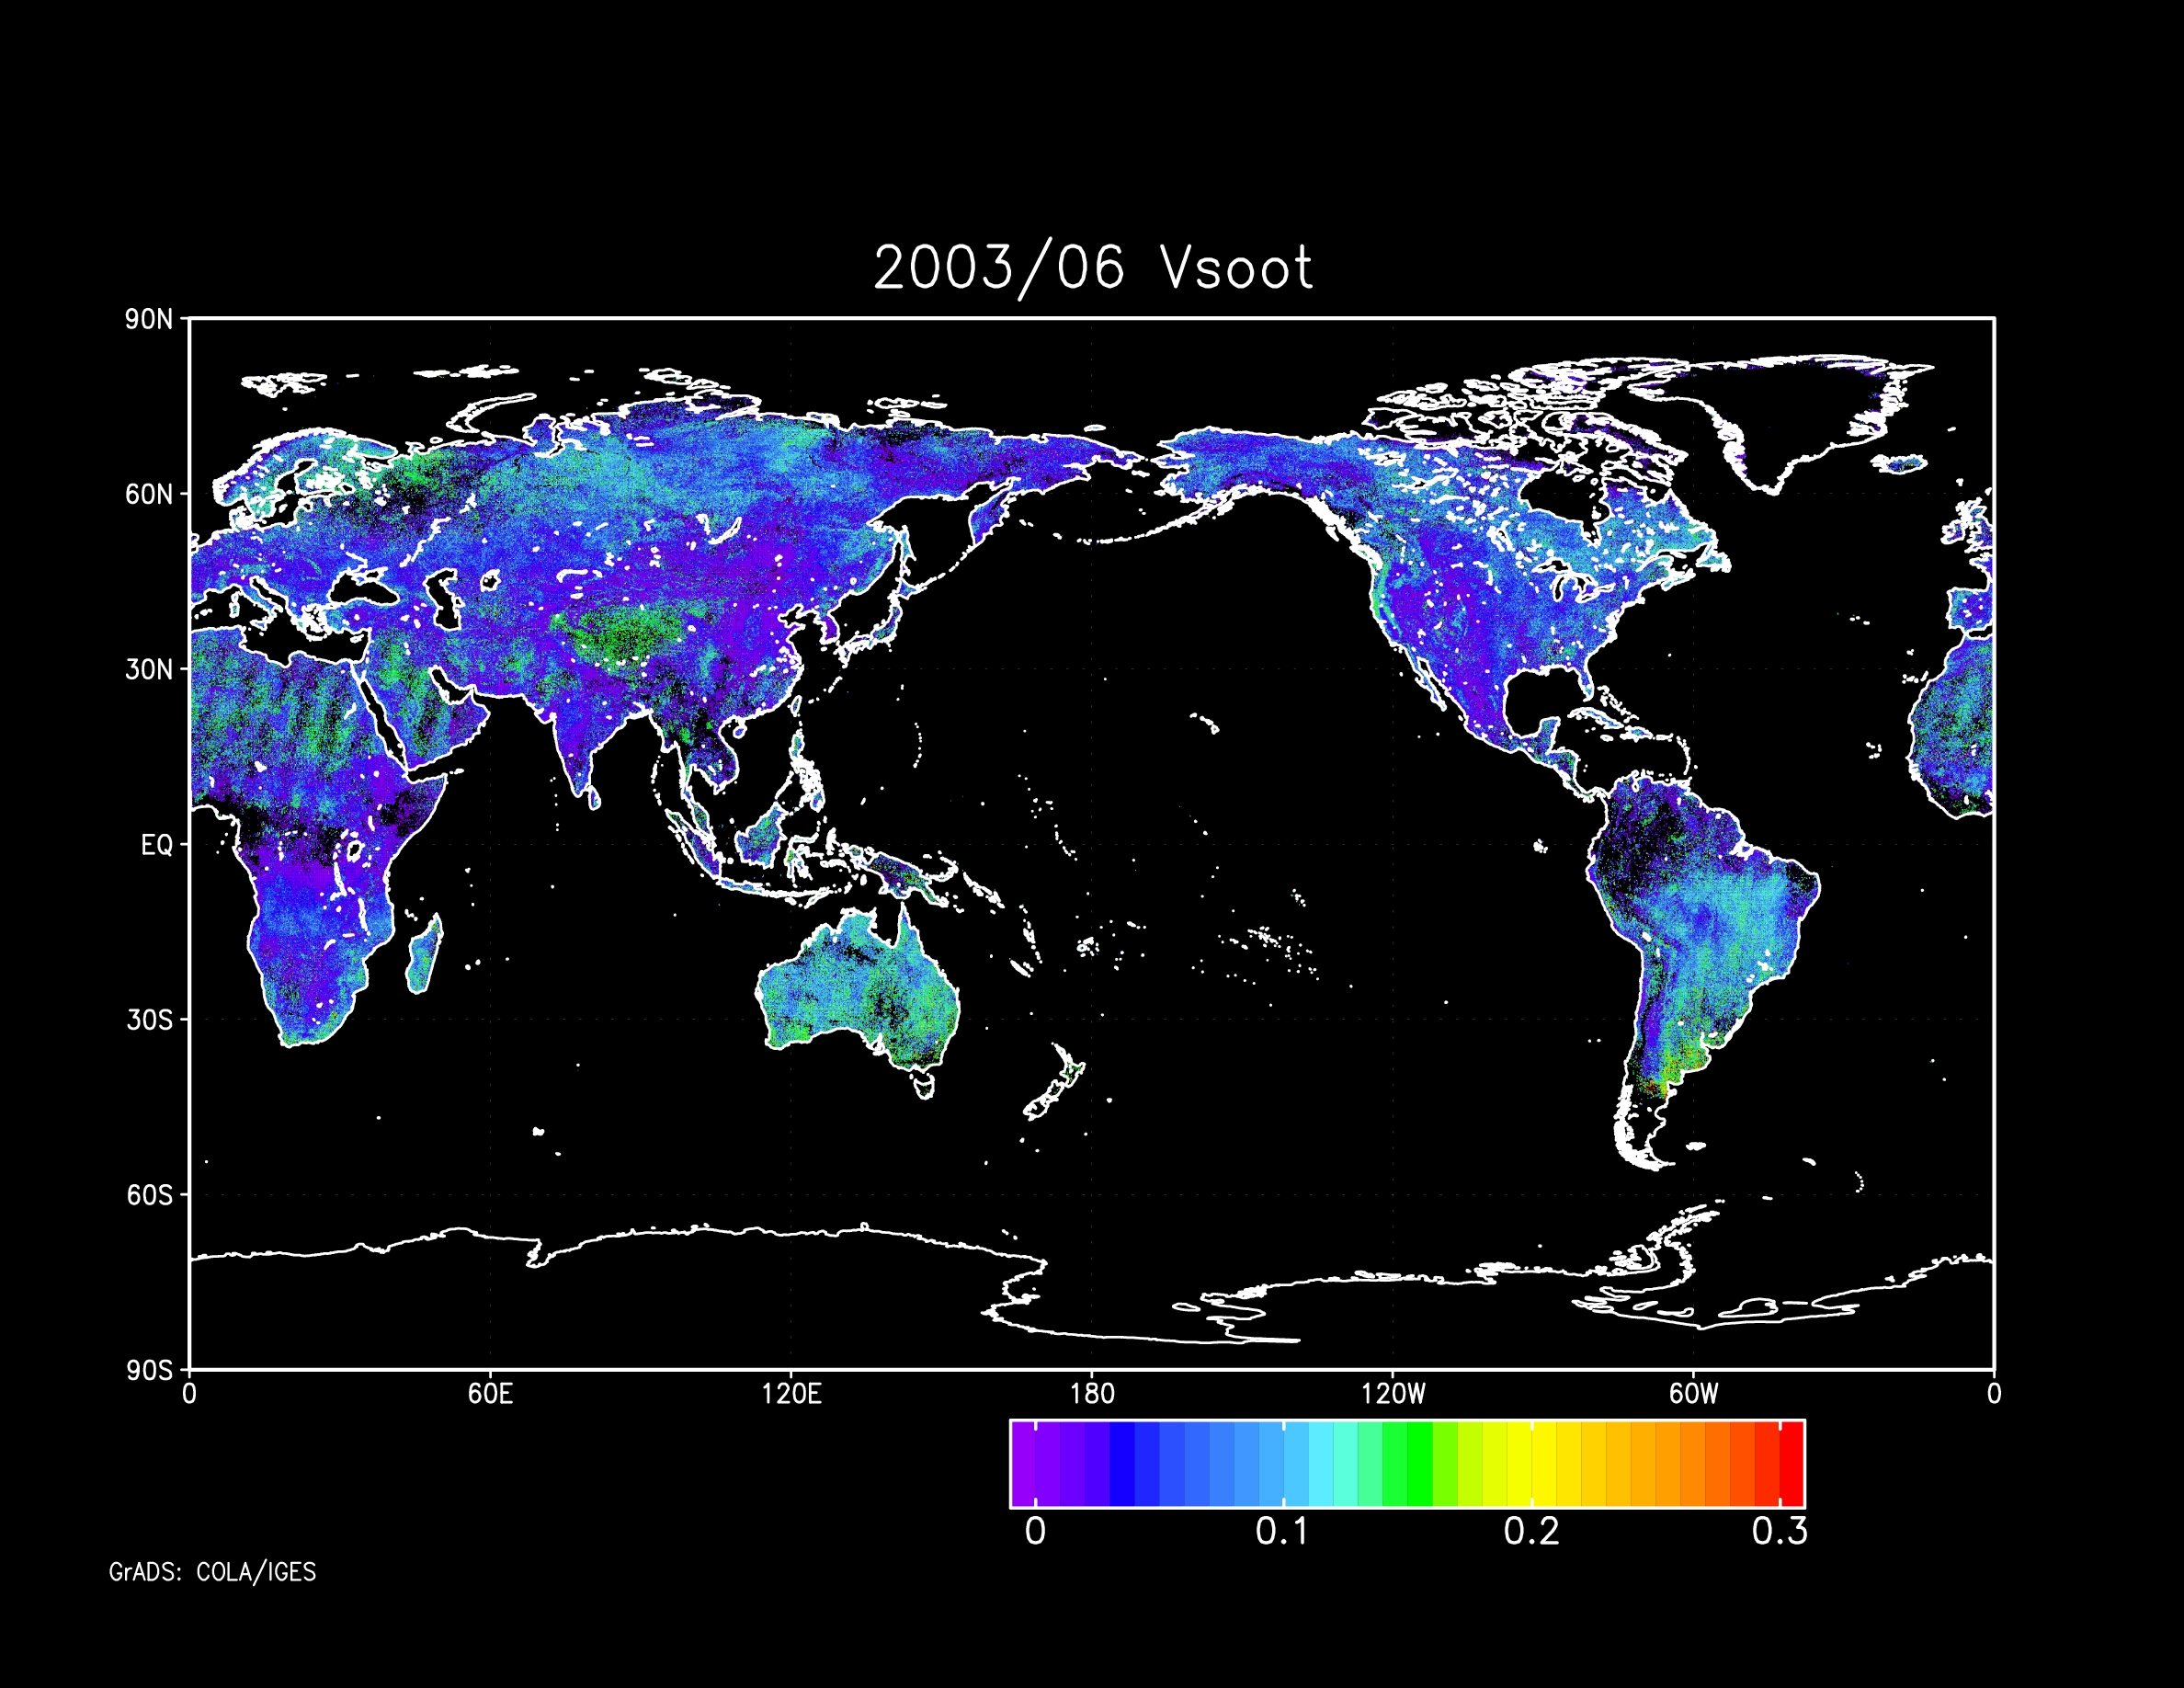
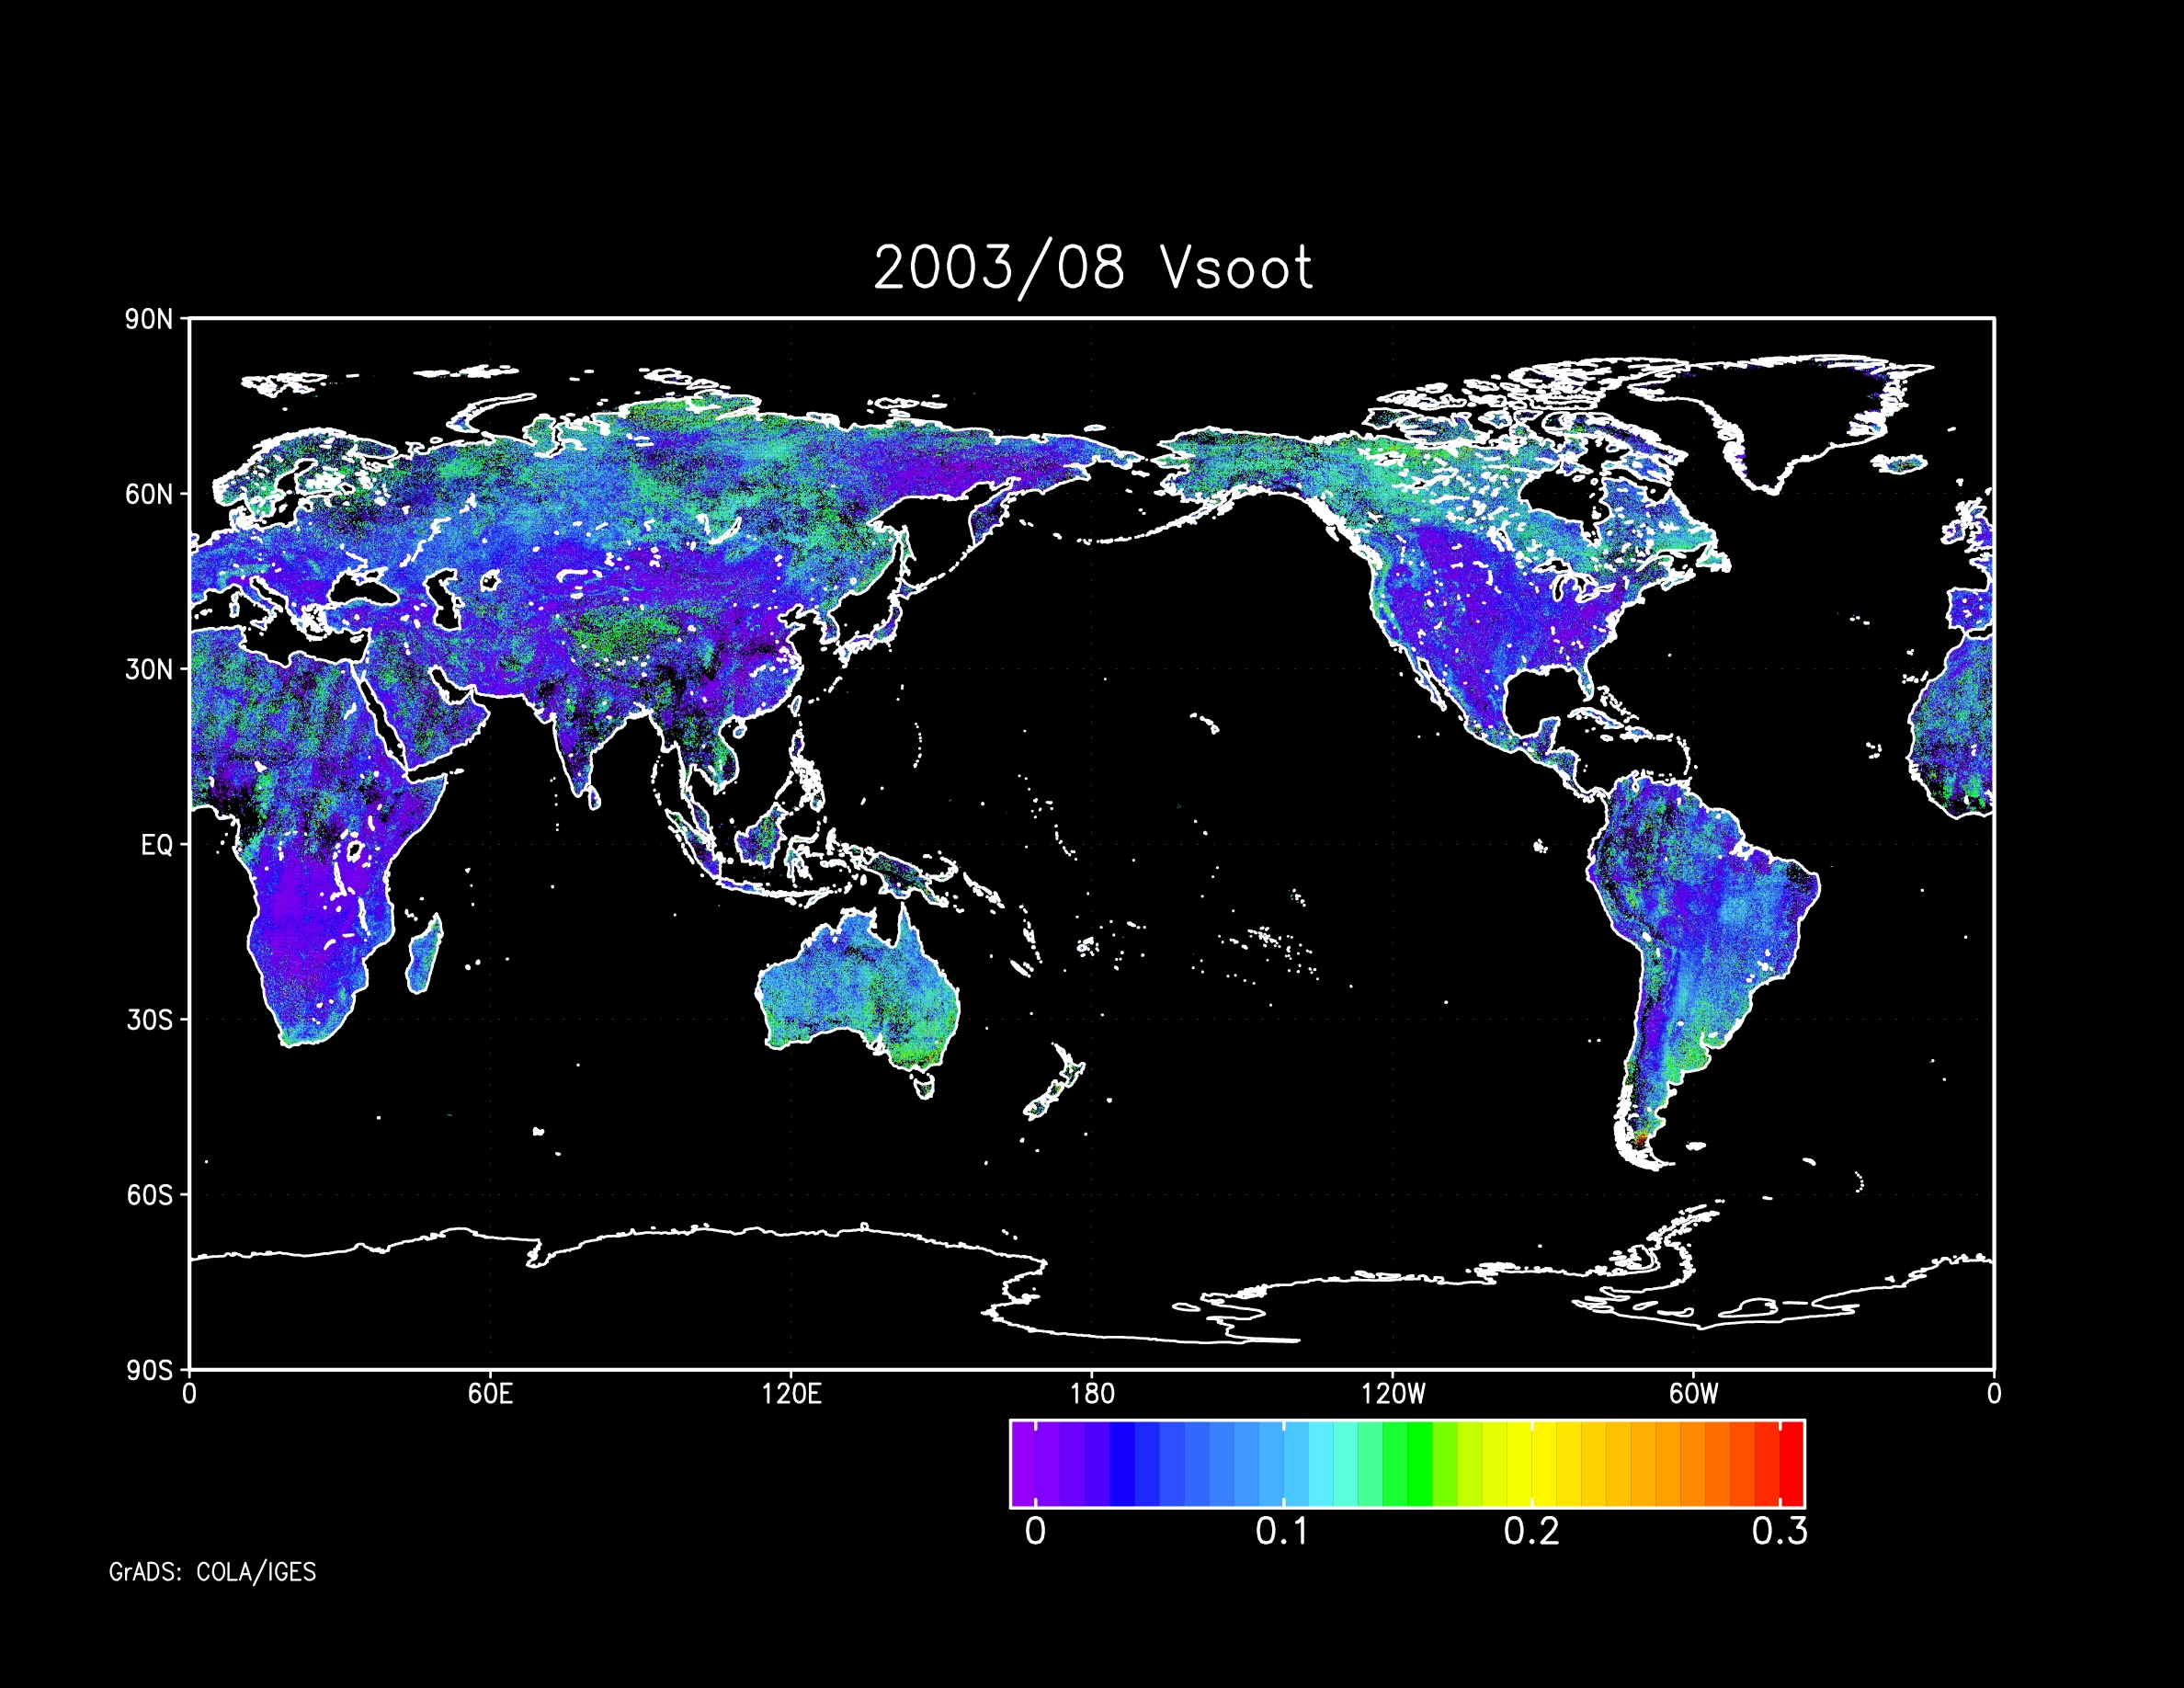
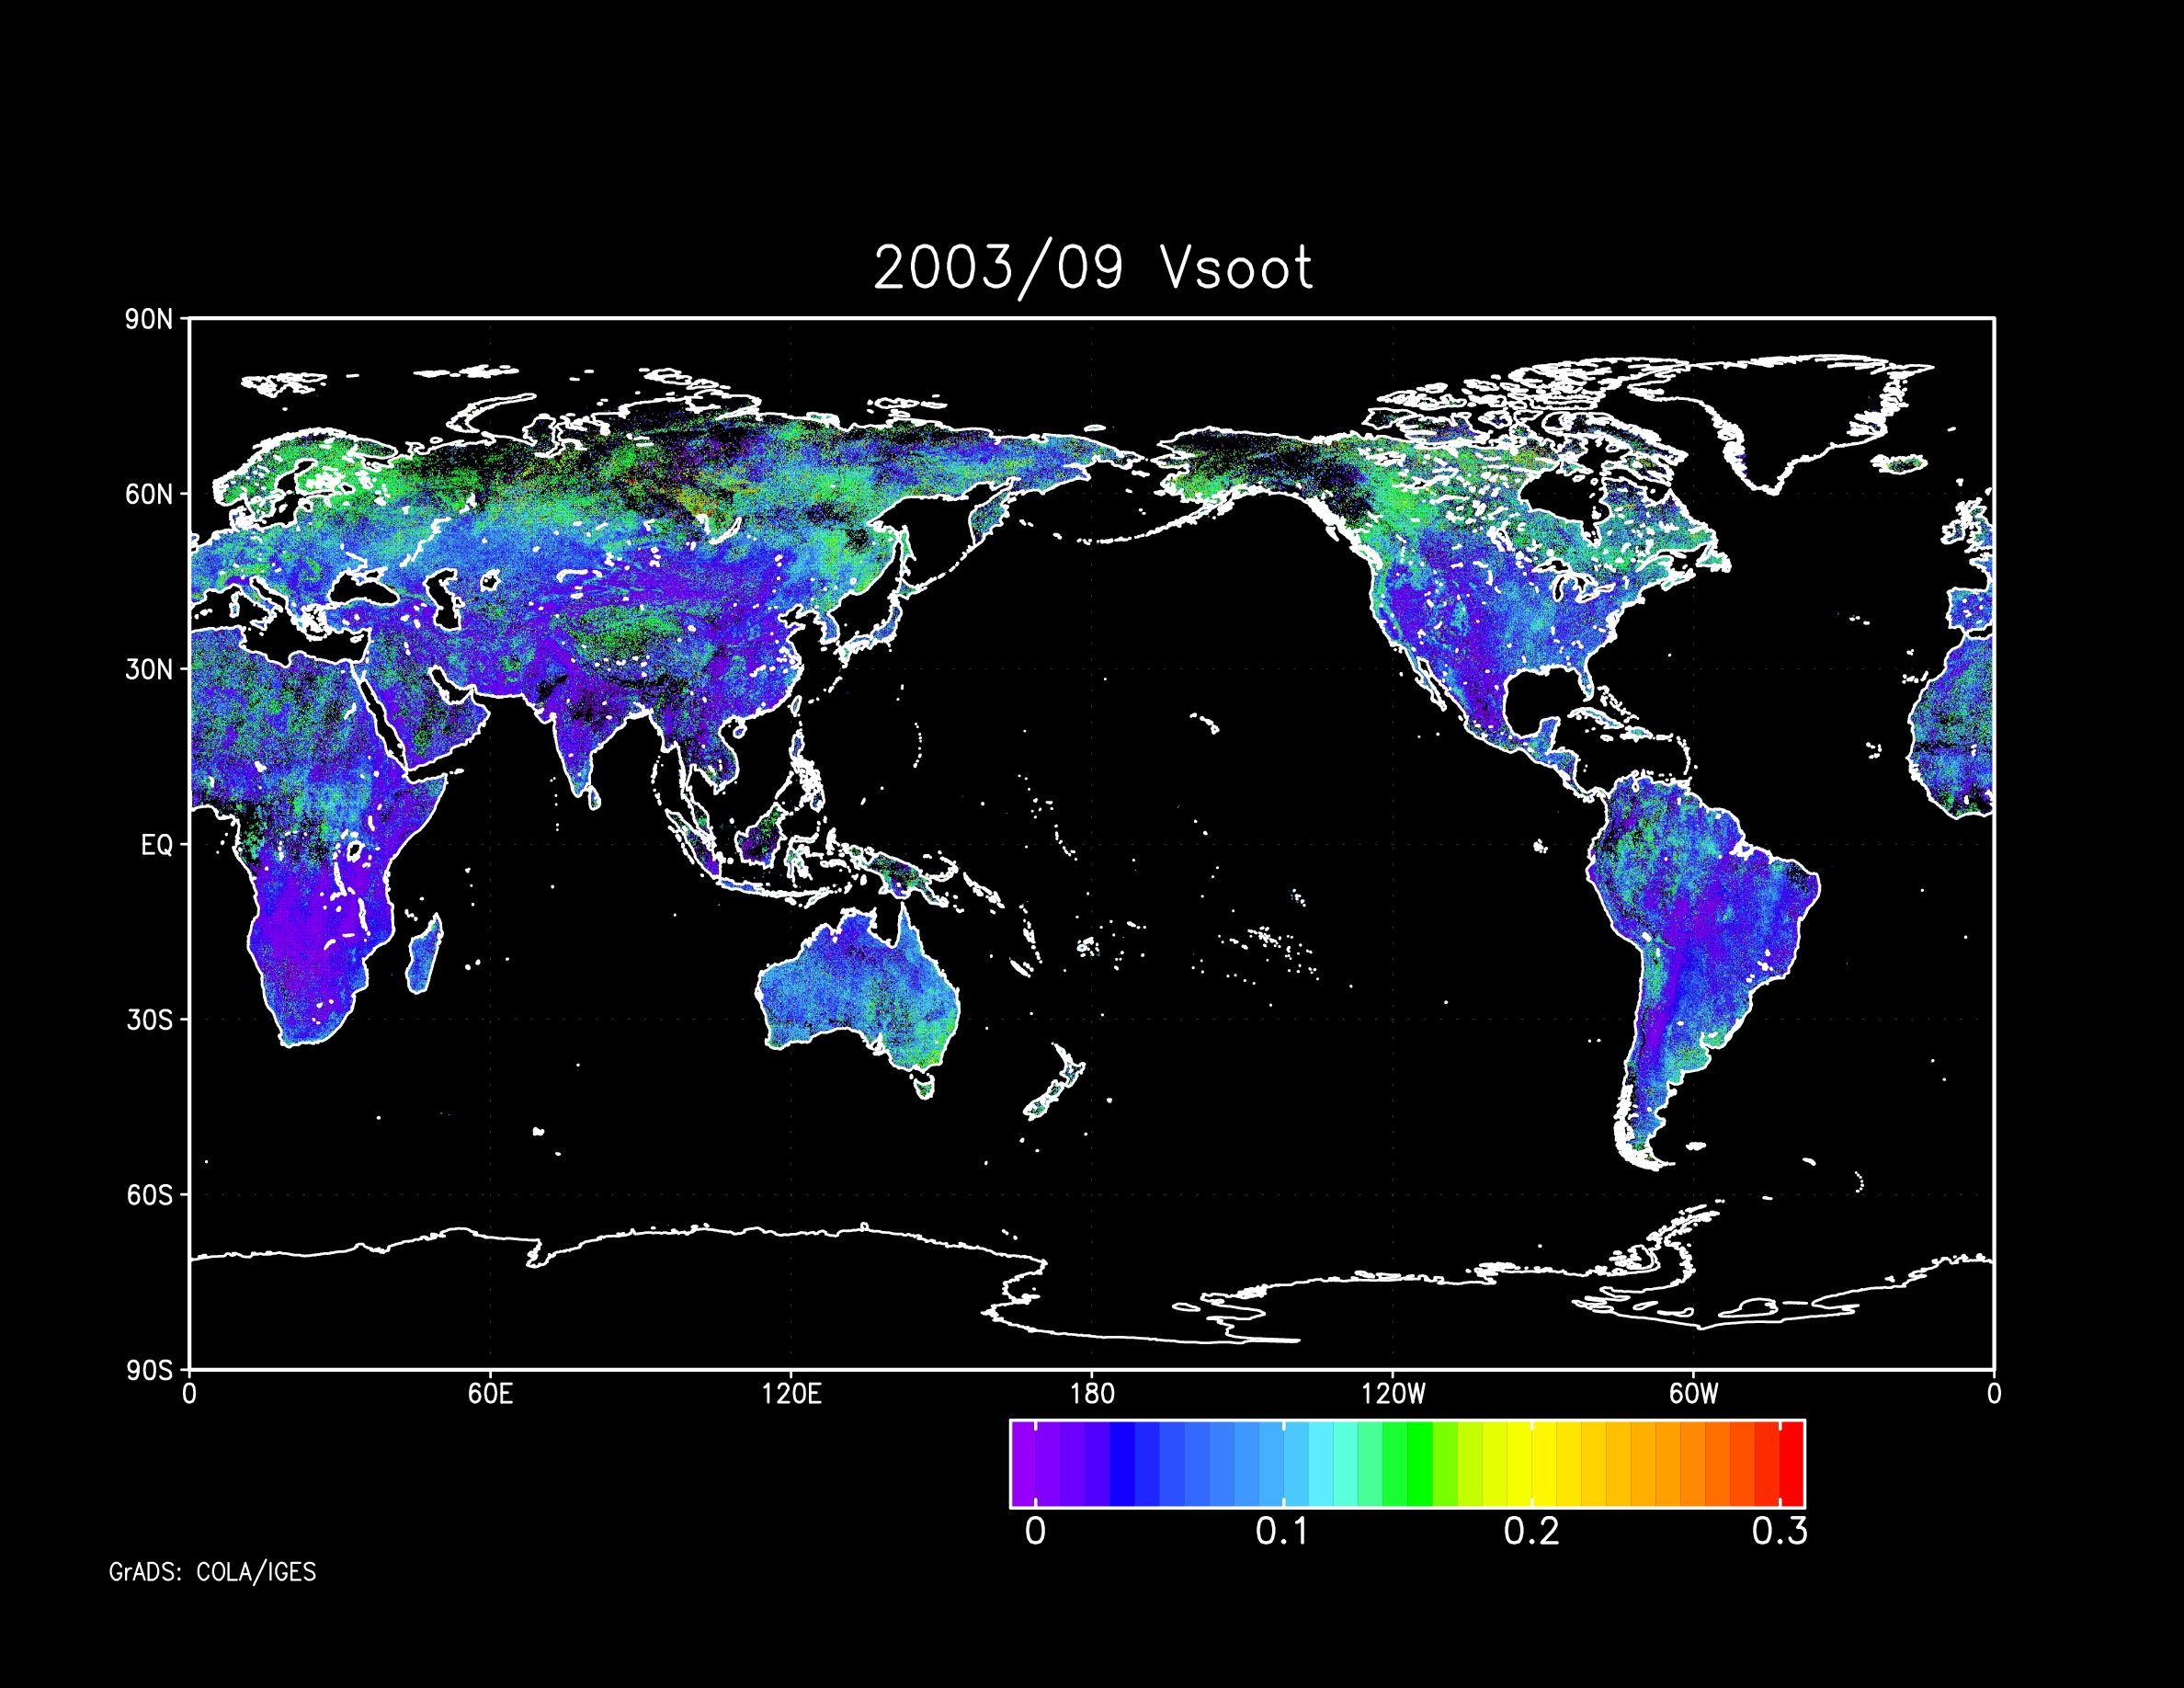
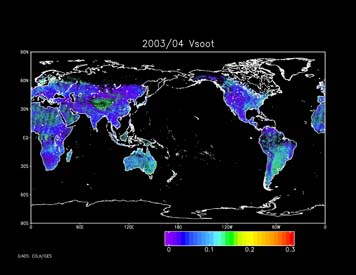
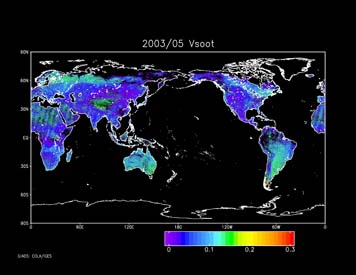
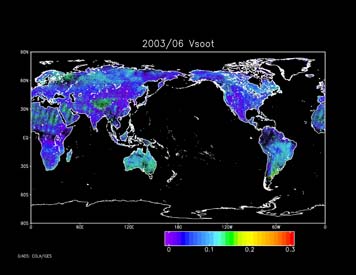
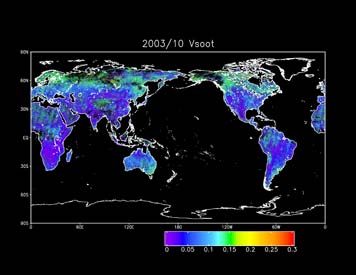
Vsoot (volume
mixing ratio of soot in accumulation mode
aerosol)
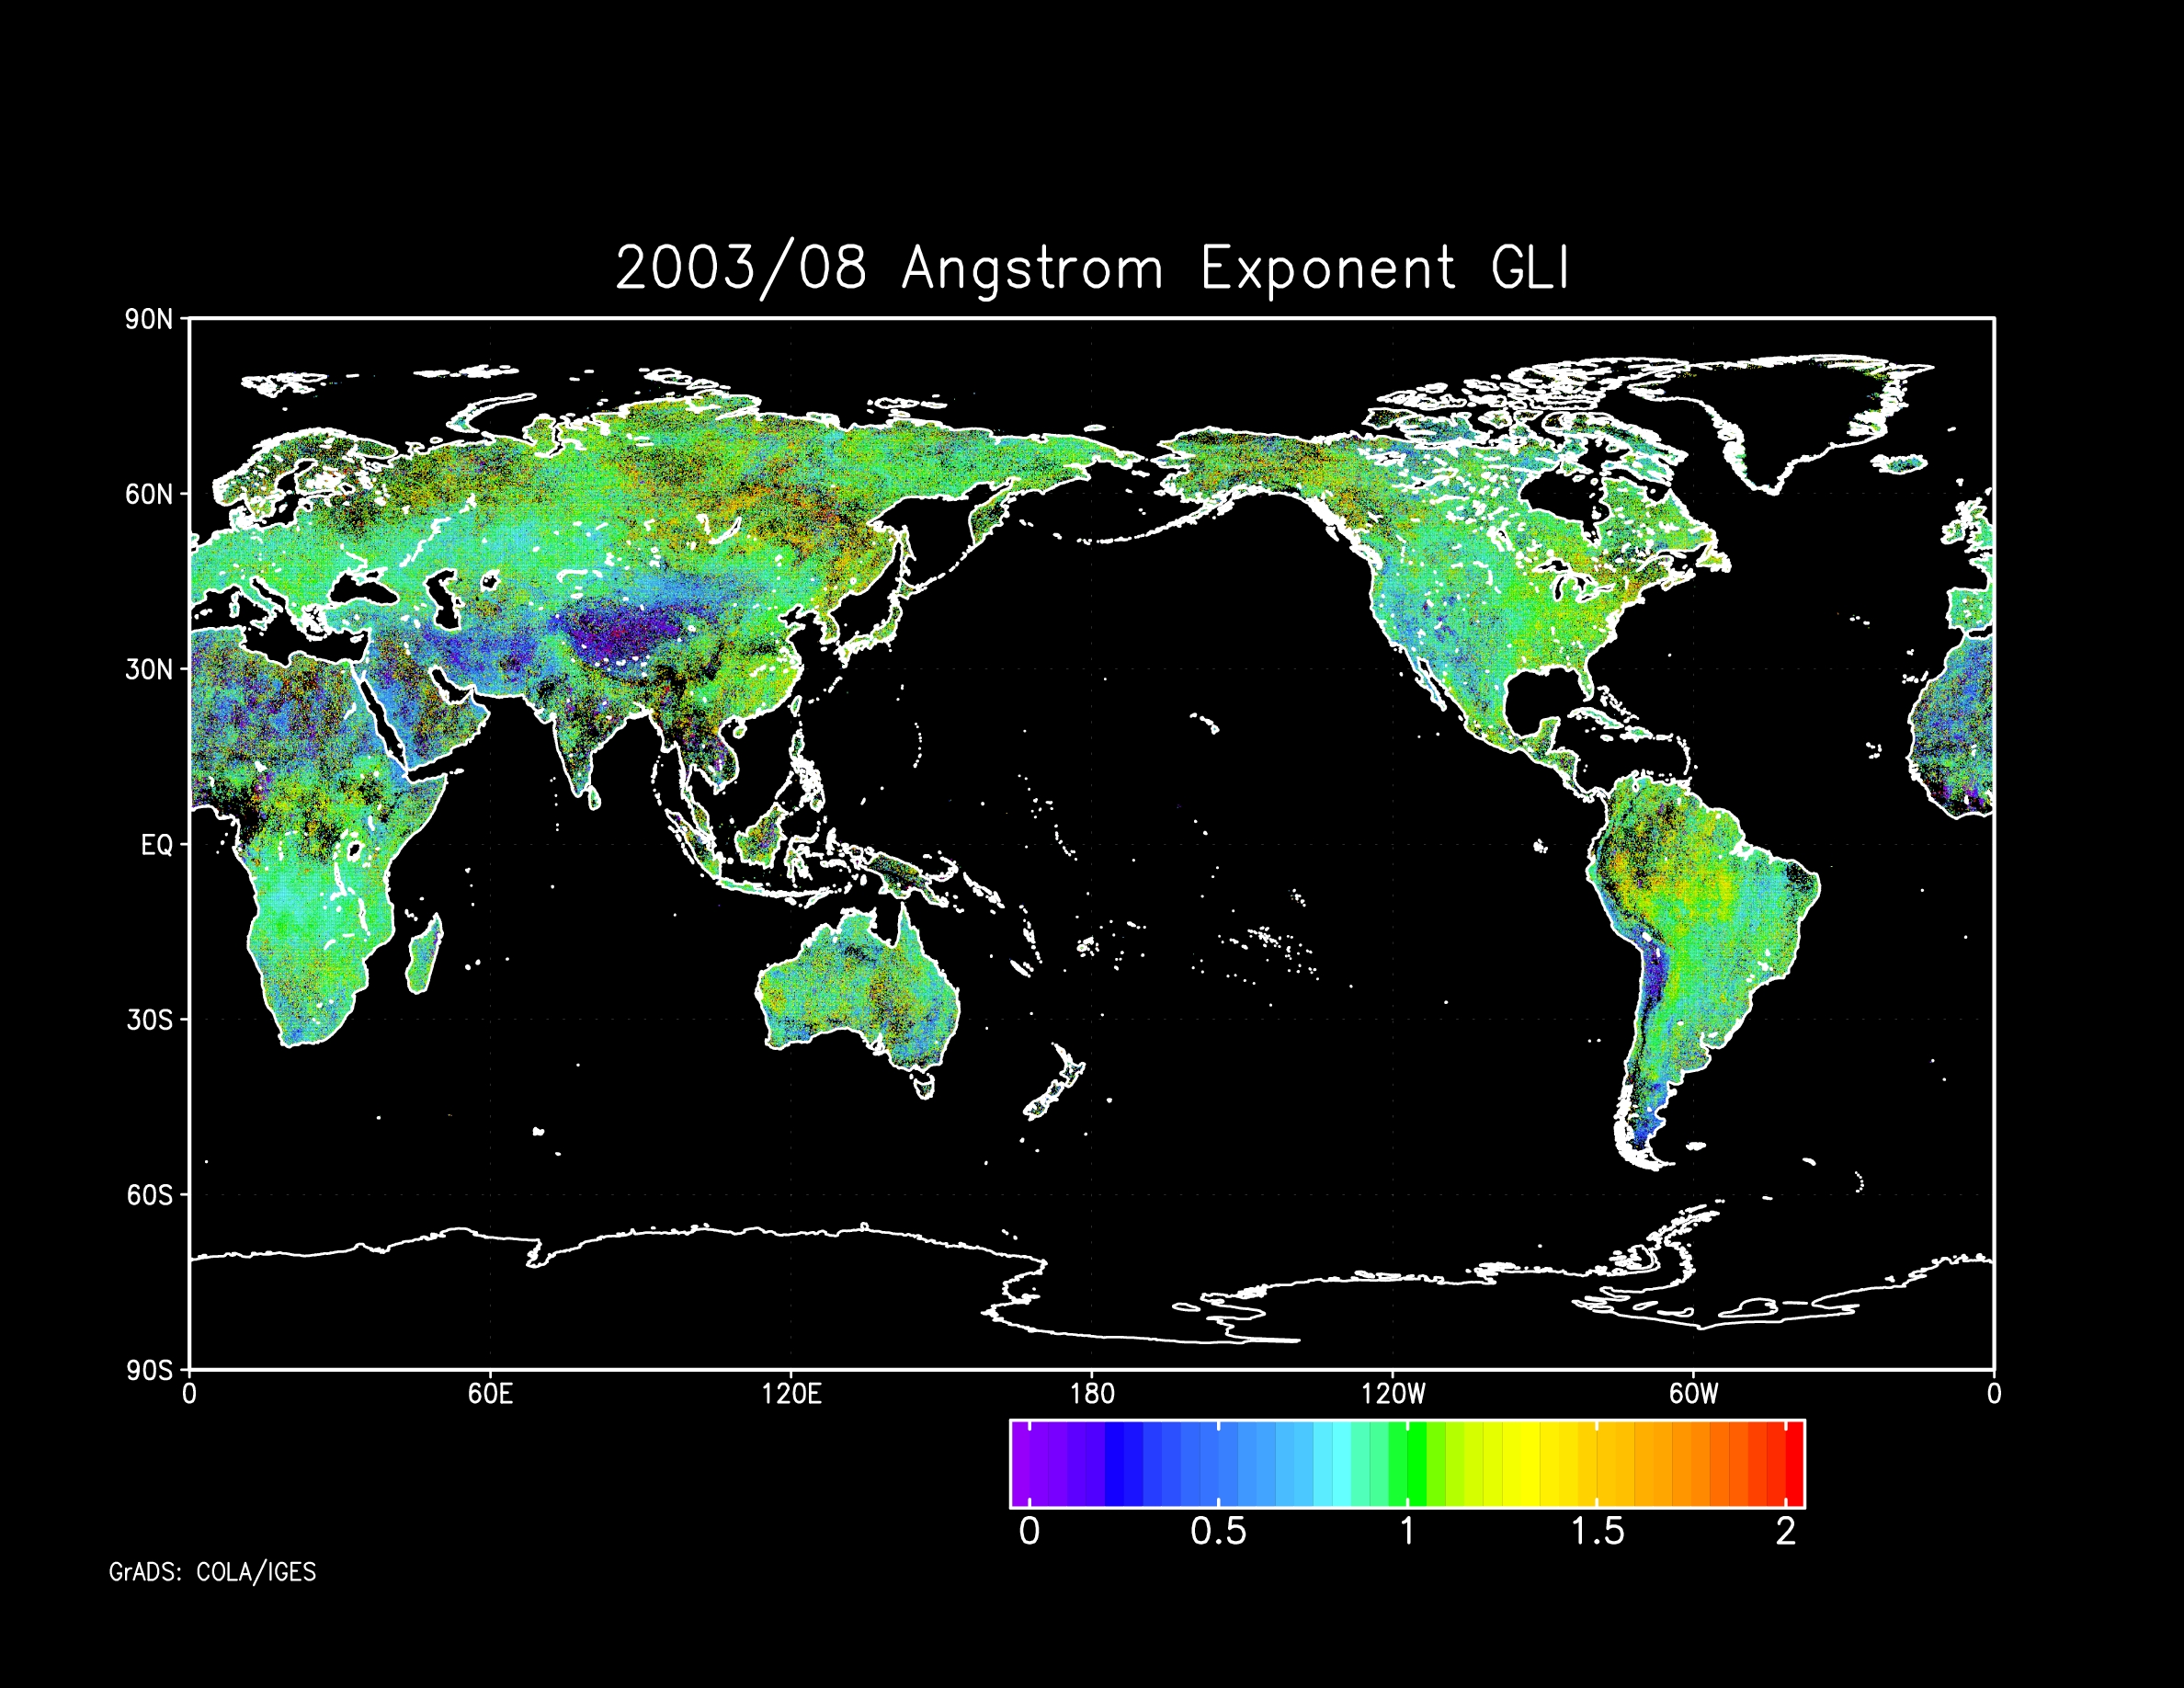
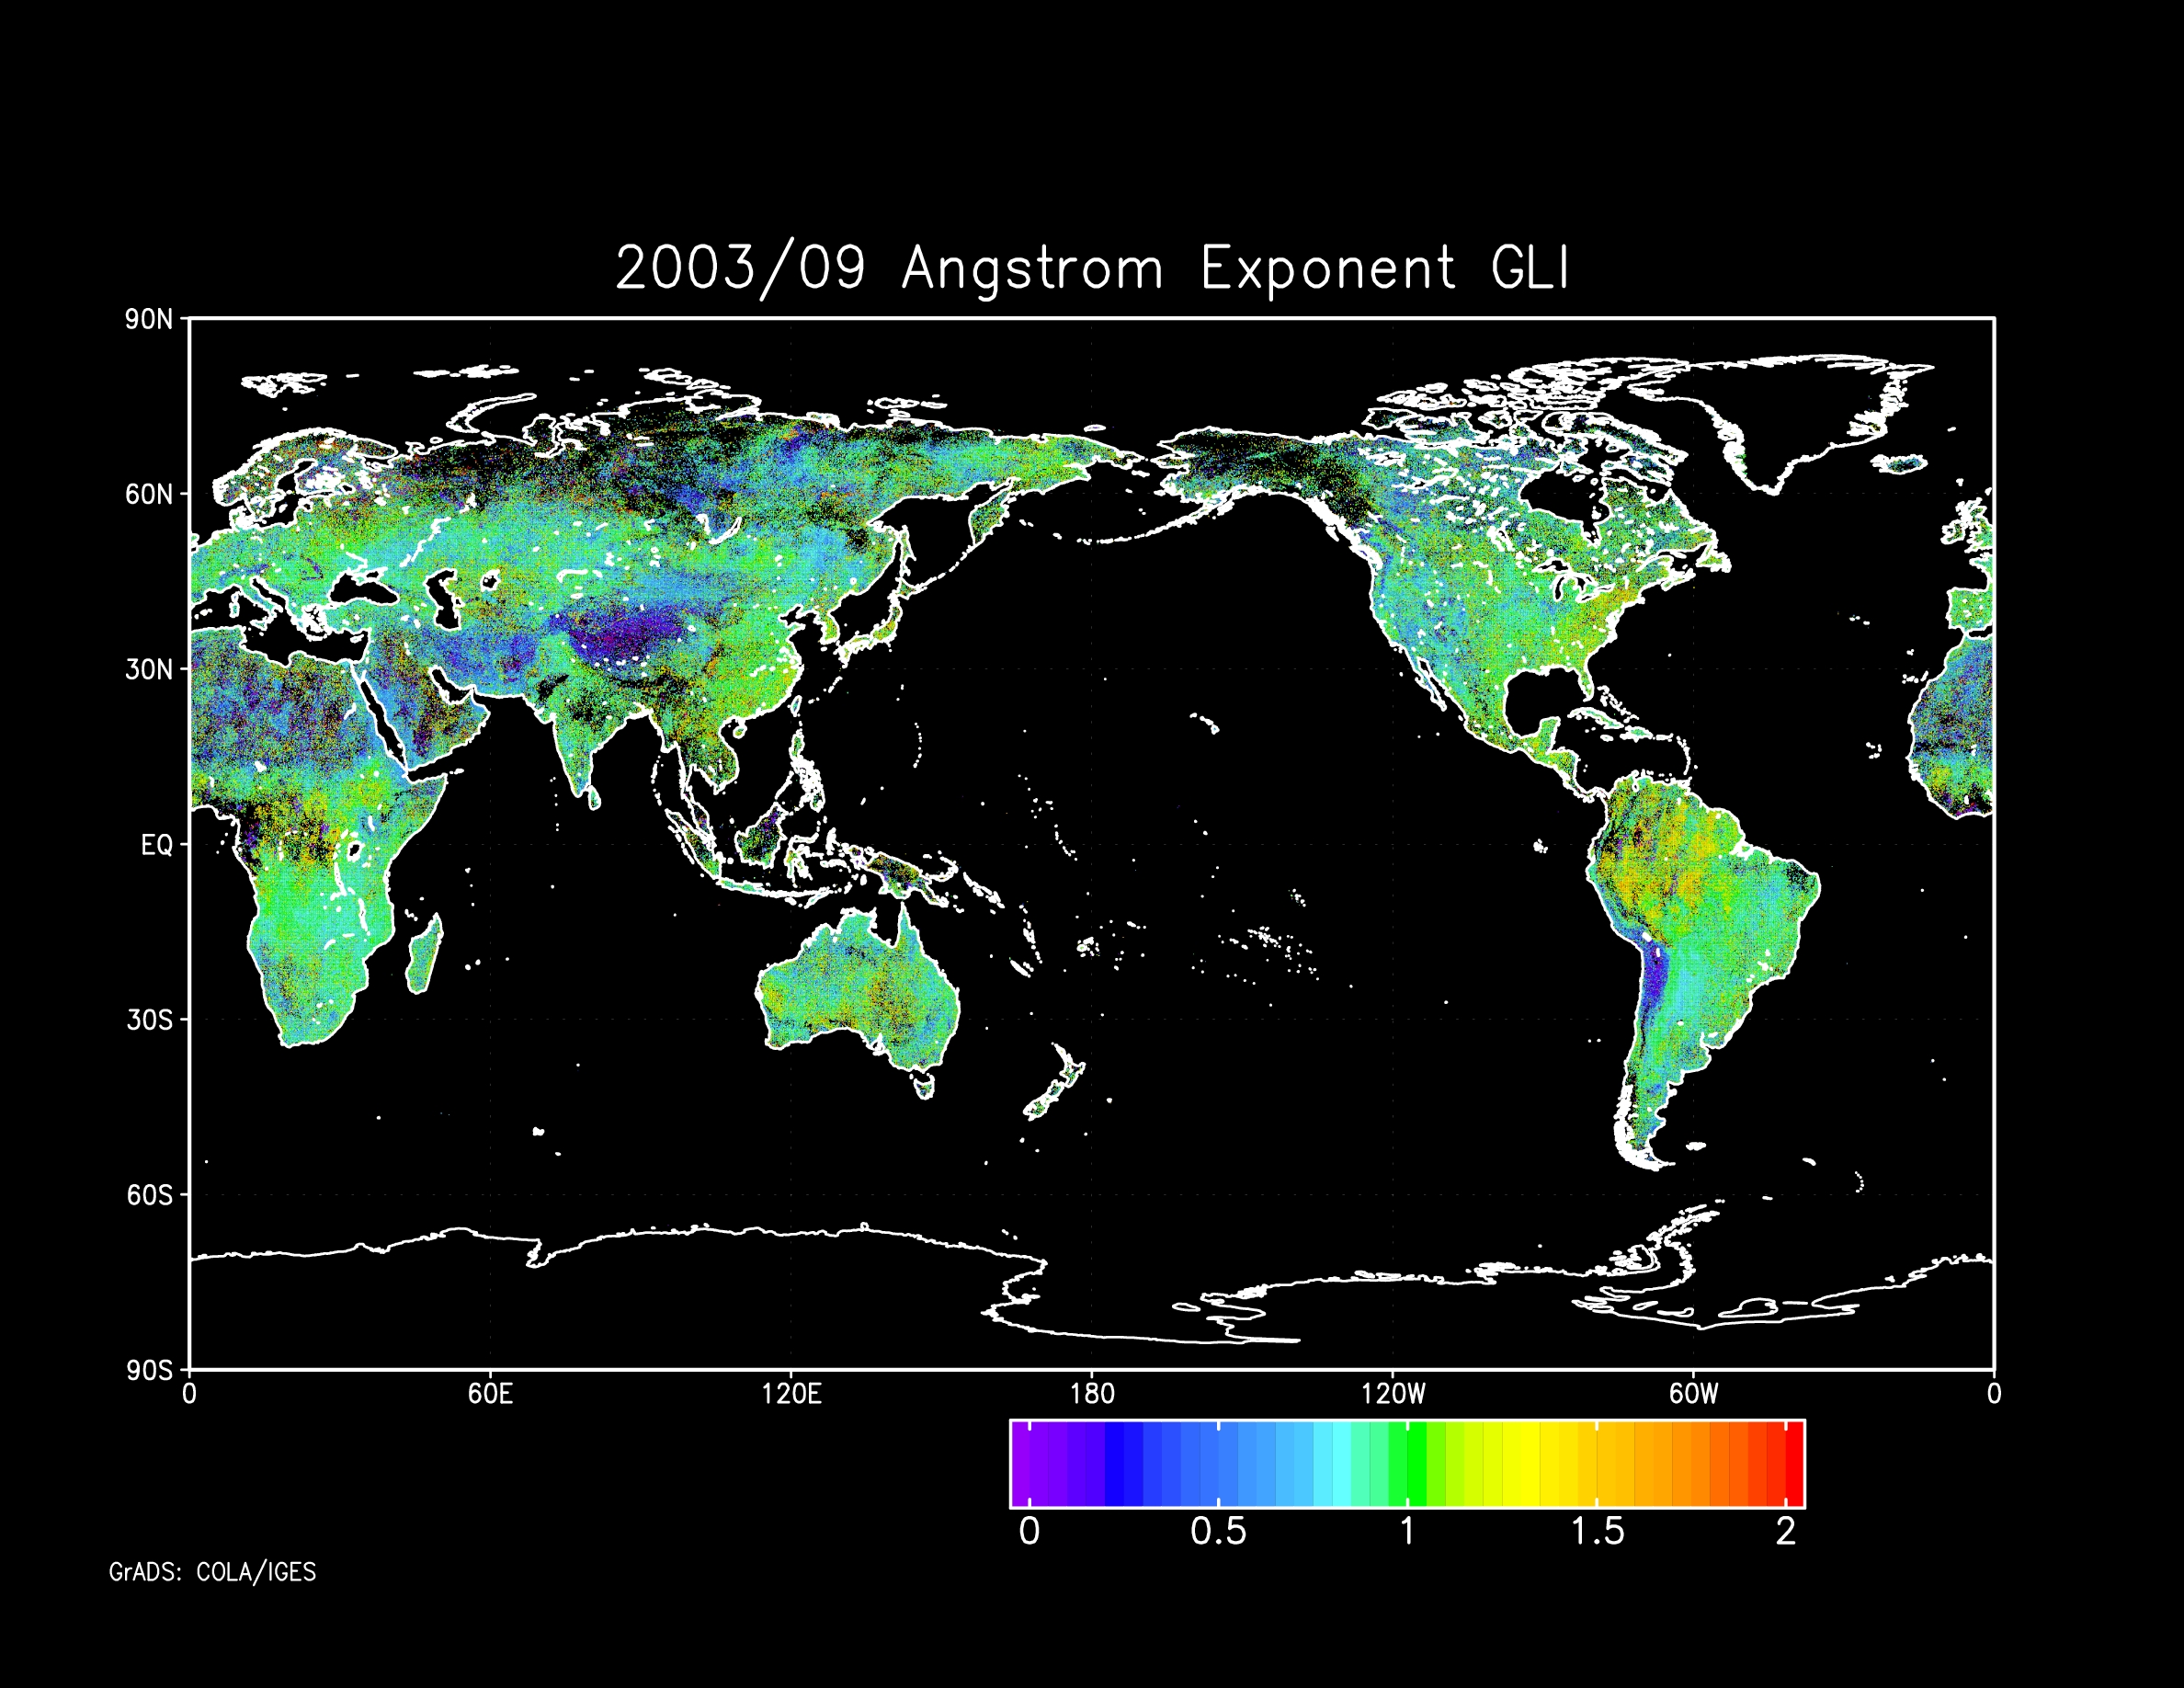
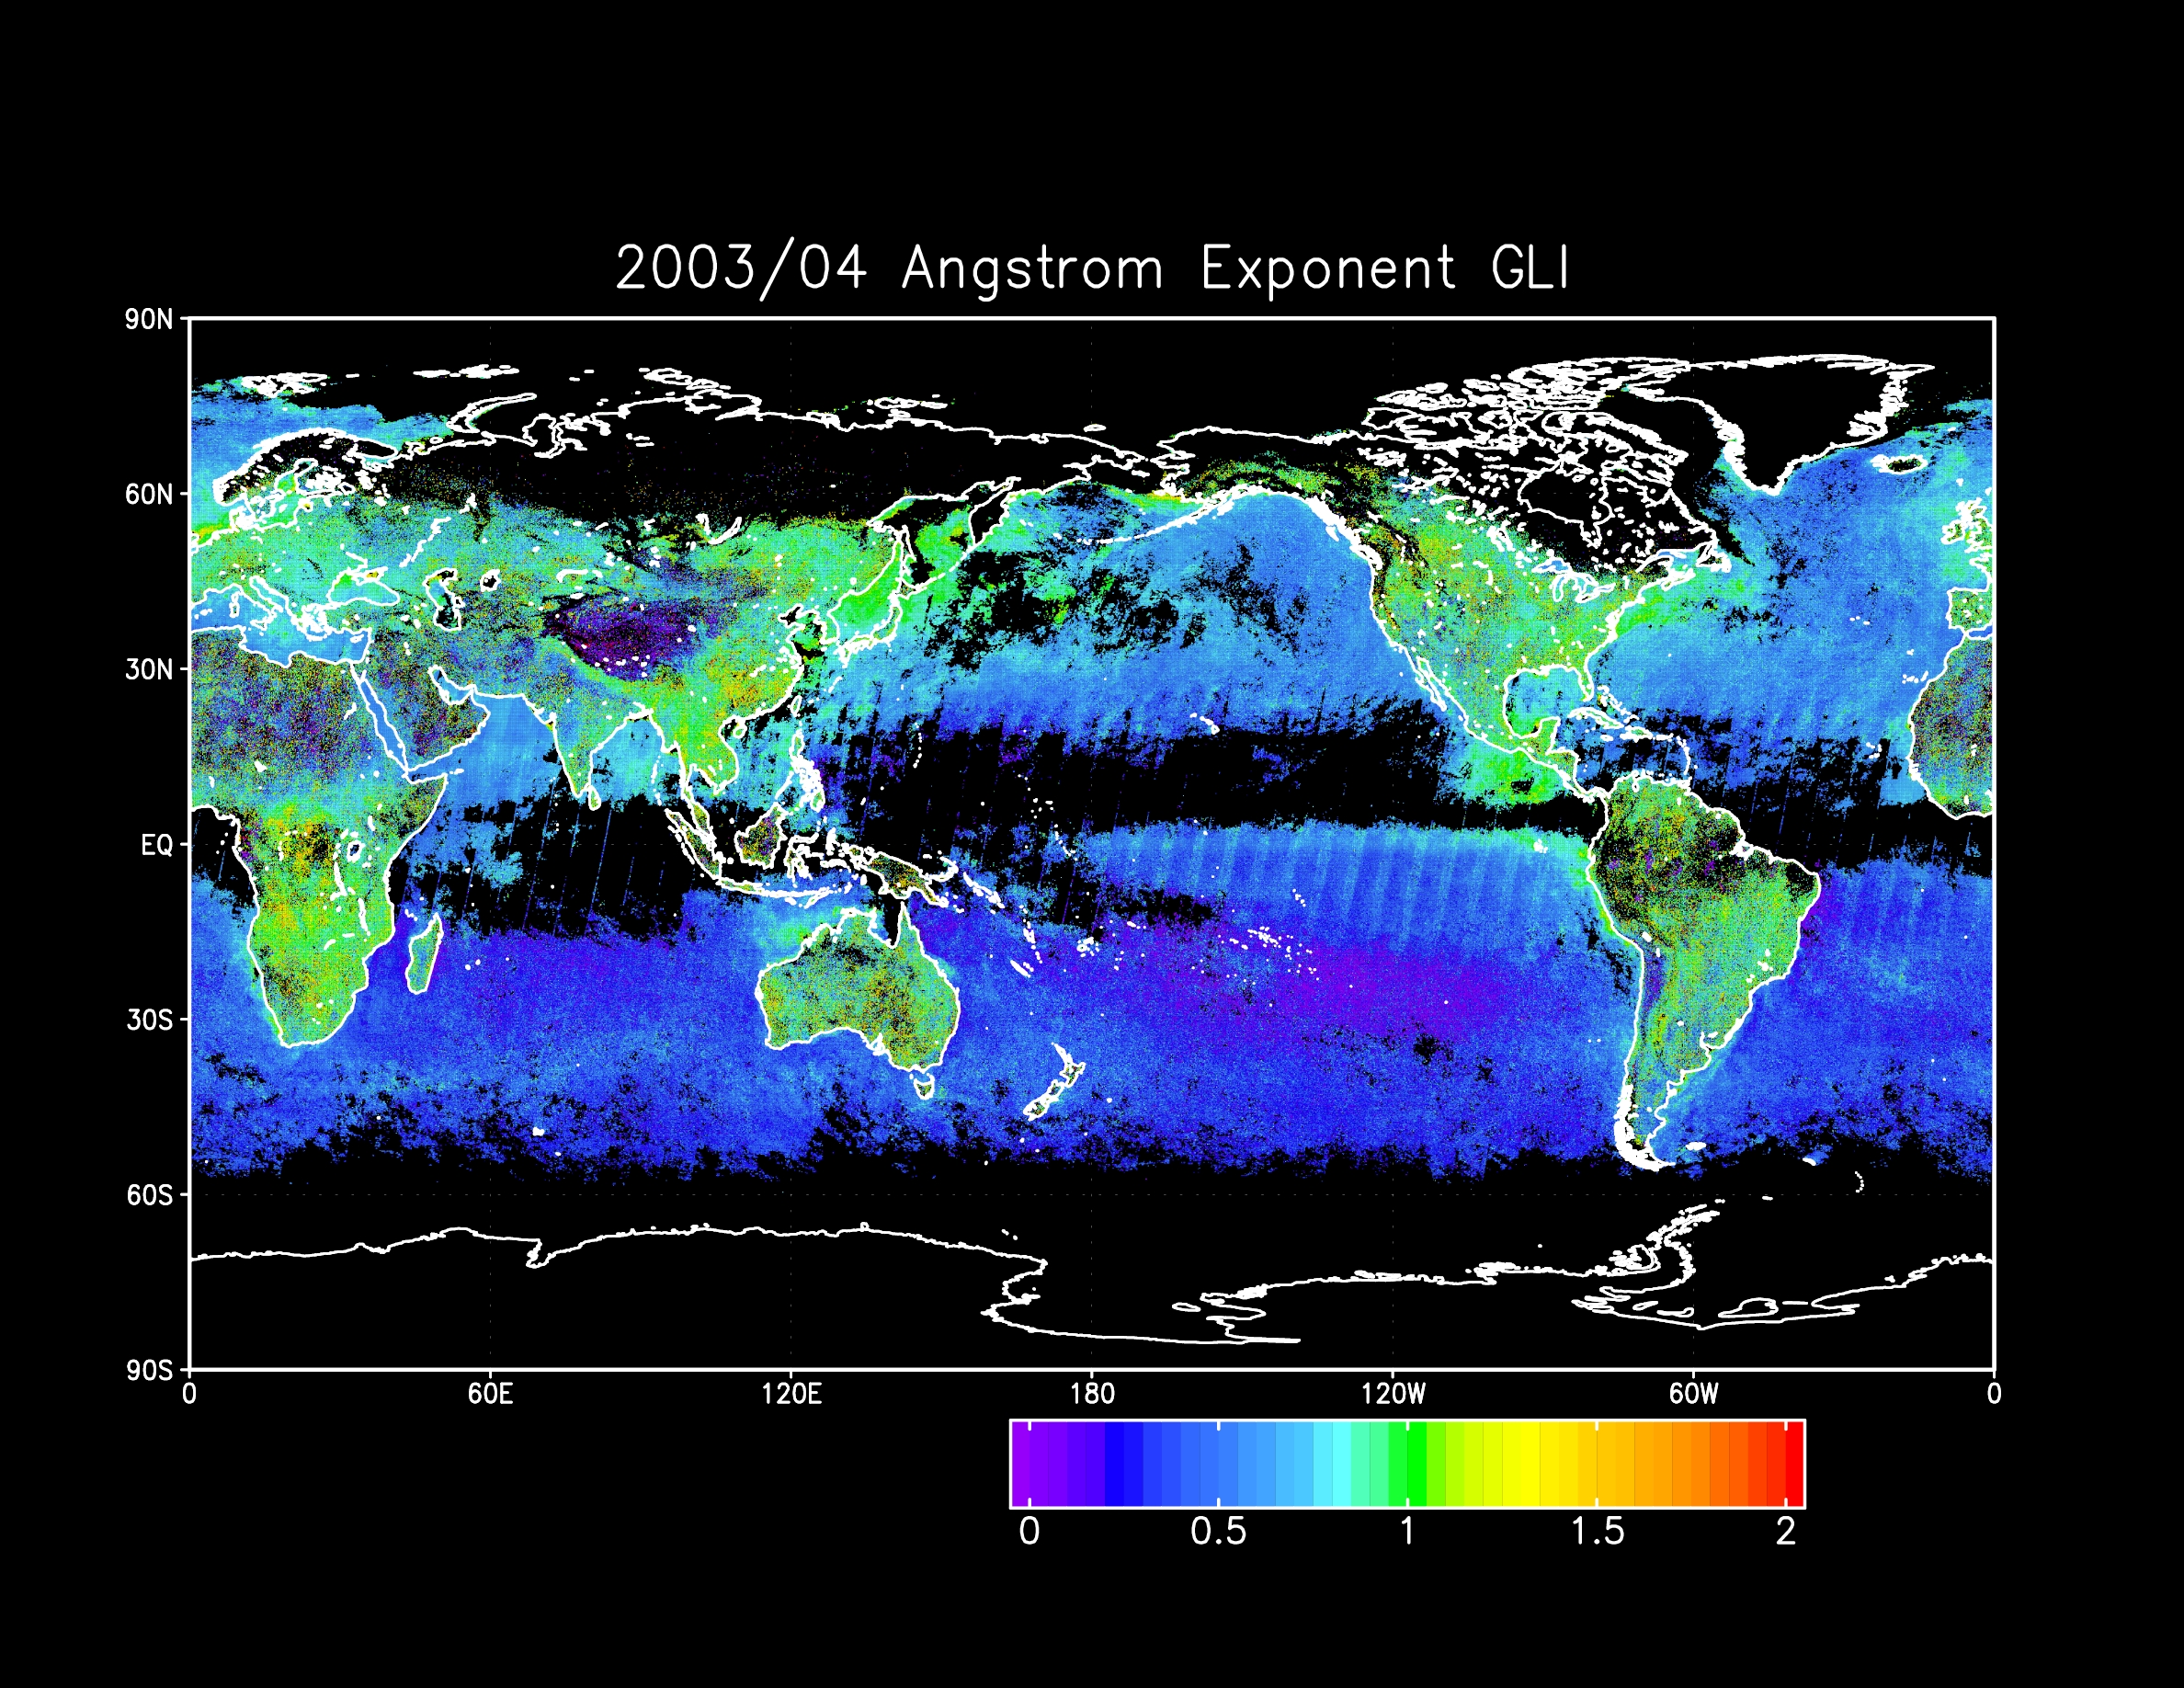
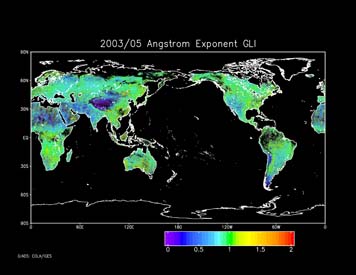
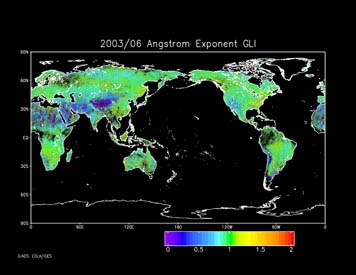
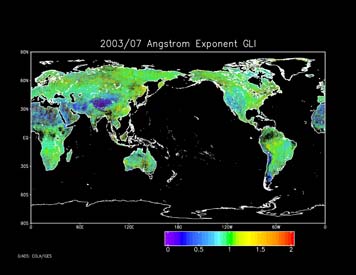
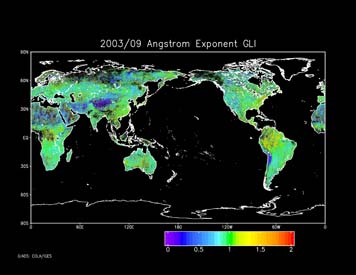
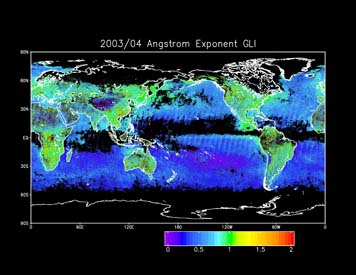
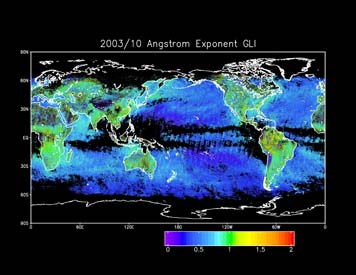
ALFA (angstrom exponent
where accumulation mode aerosol = soot + sulfate
データの説明:
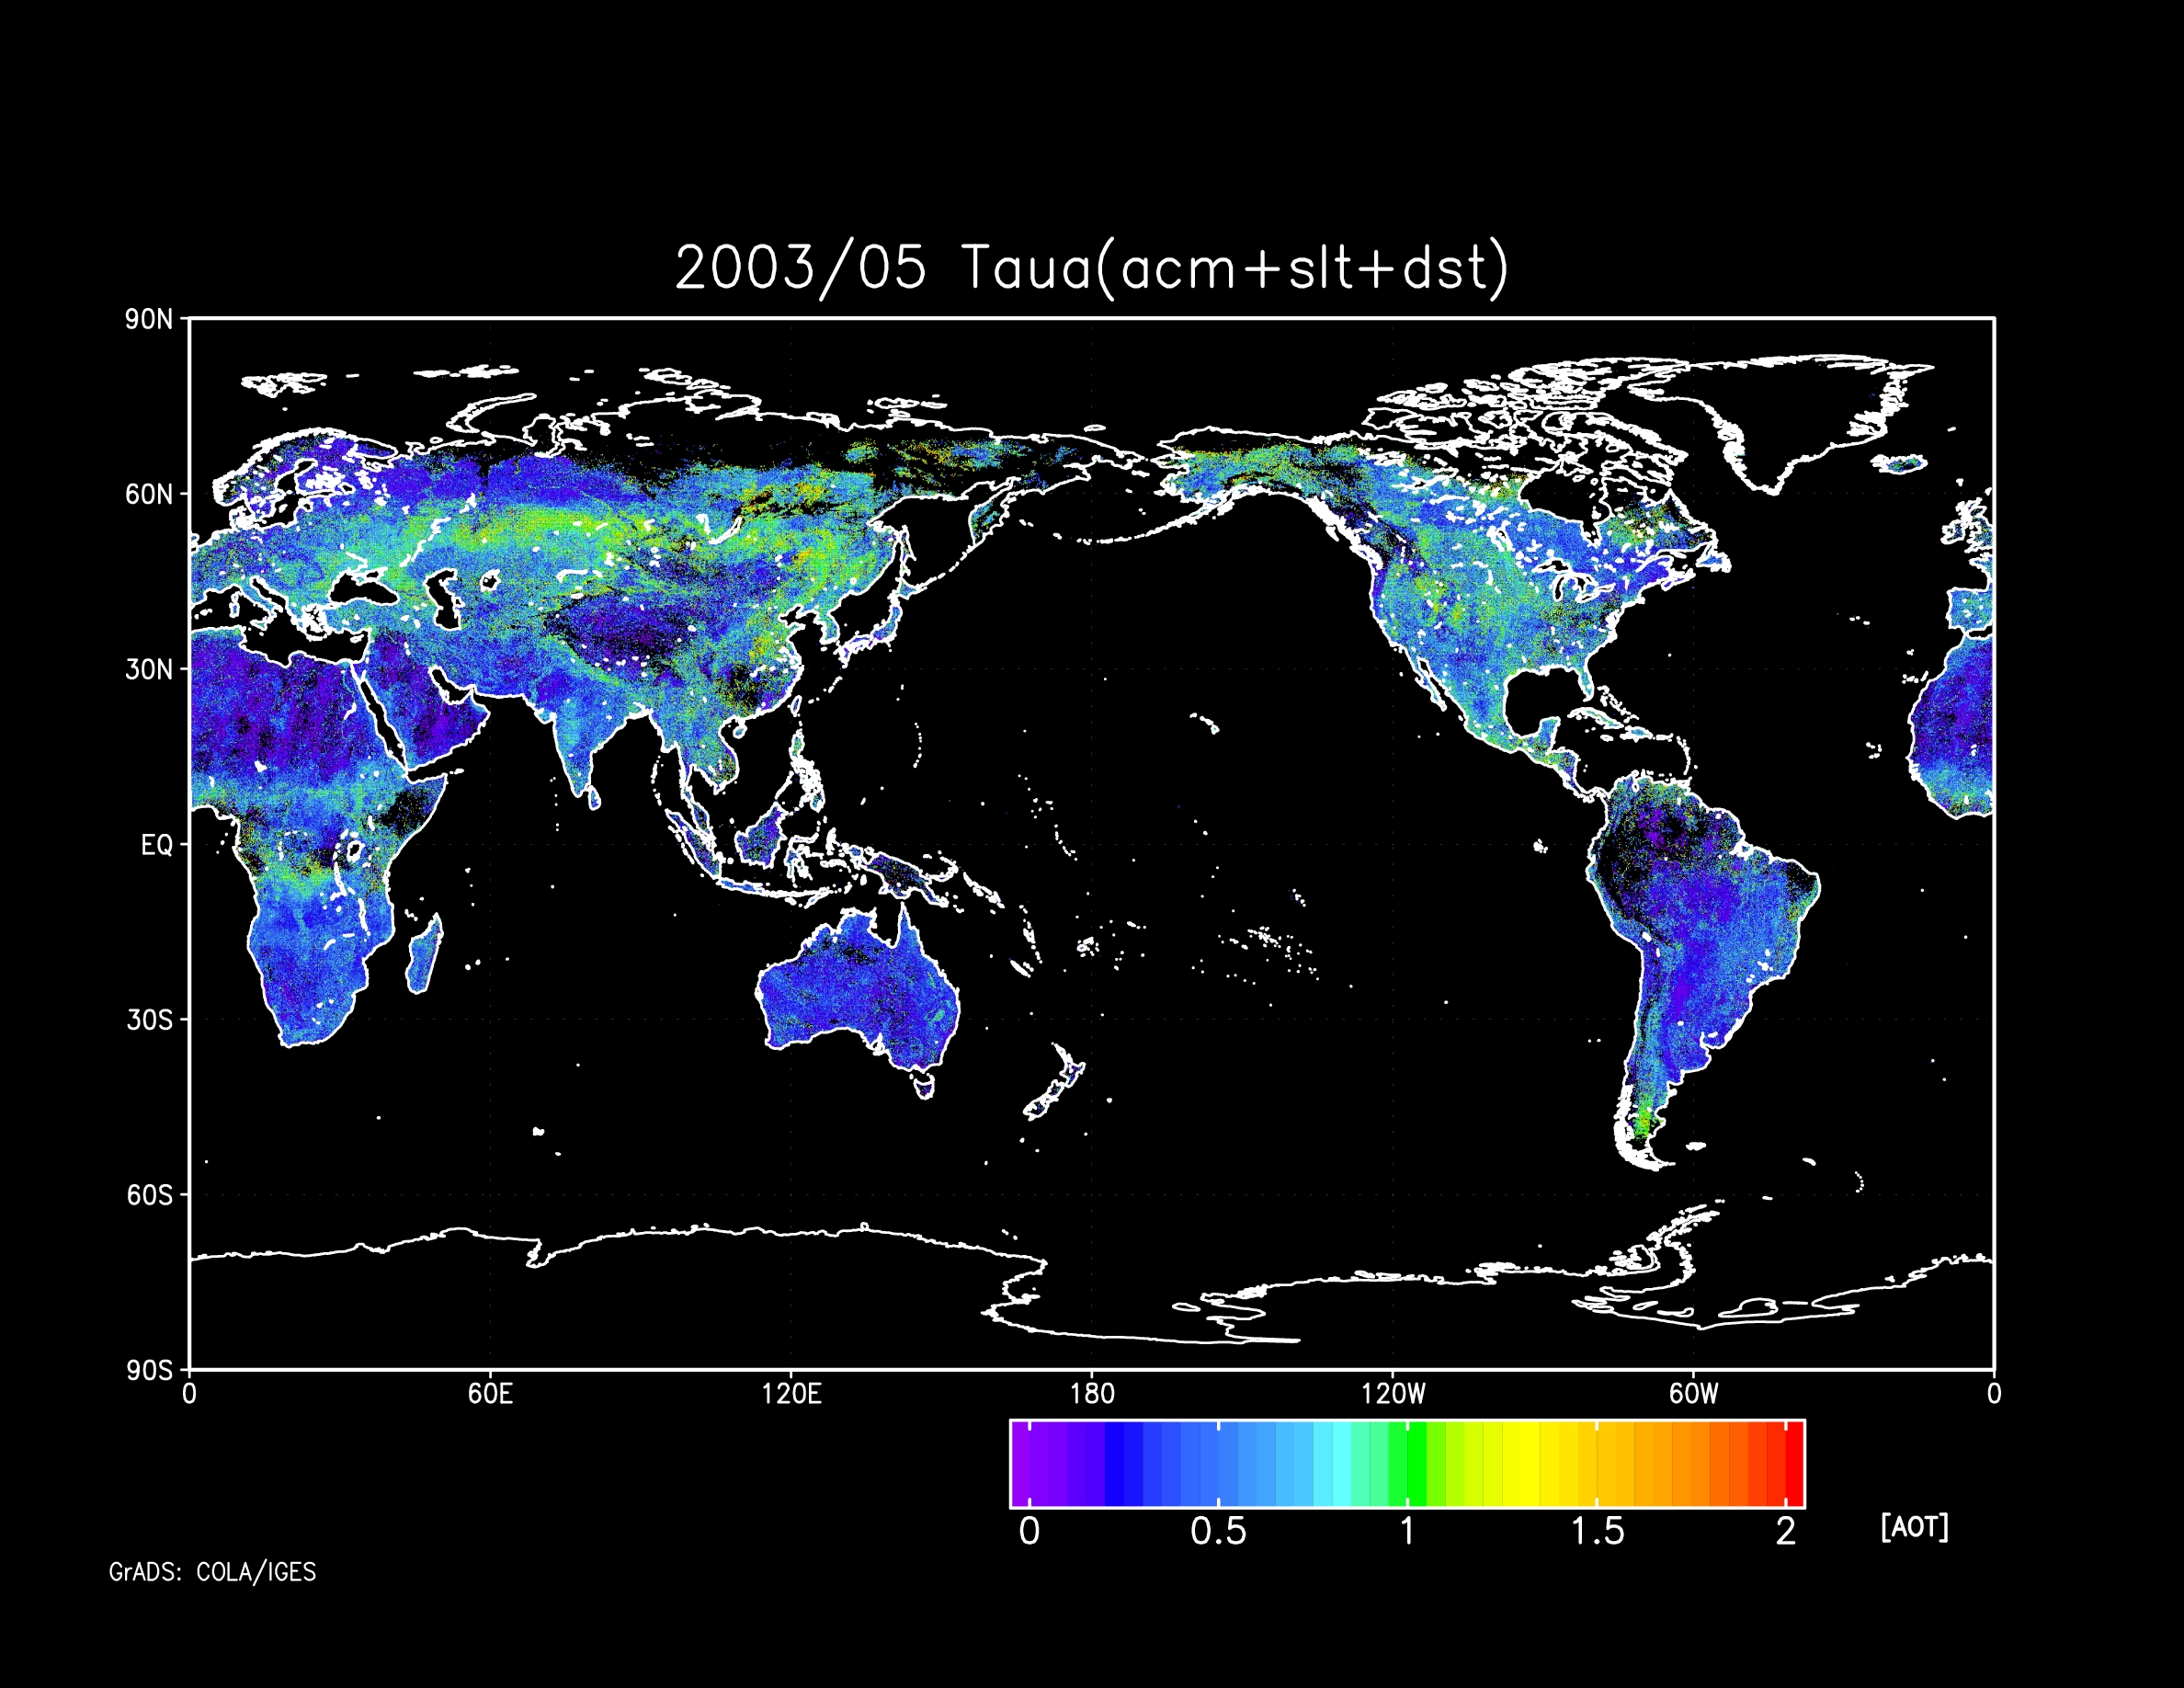
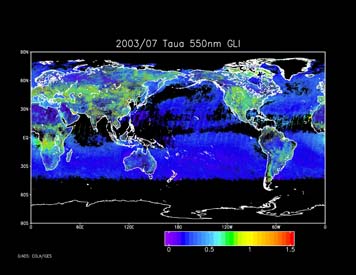
GLIには380nmの近紫外波長に感度を持つチャンネルがある。この波長の地表面アルベドはとても小さいので、陸域におけるエアロゾル導出に有効である。本研究では3モード(アキミュレーション、海塩、ダスト)のエアロゾルを仮定し、MAP法(Rodgers,
2000)を用いて各々のエアロゾルの光学的厚さの導出を行った。また、この波長を使うことにより吸収性エアロゾルの検出ができる。本研究では、アキミュレーションモードにしめるススの混合比として、この吸収性エアロゾルの導出をおこなった。(福田悟,
Center for Climate System Research, The University of Tokyo, Jan.
2008)
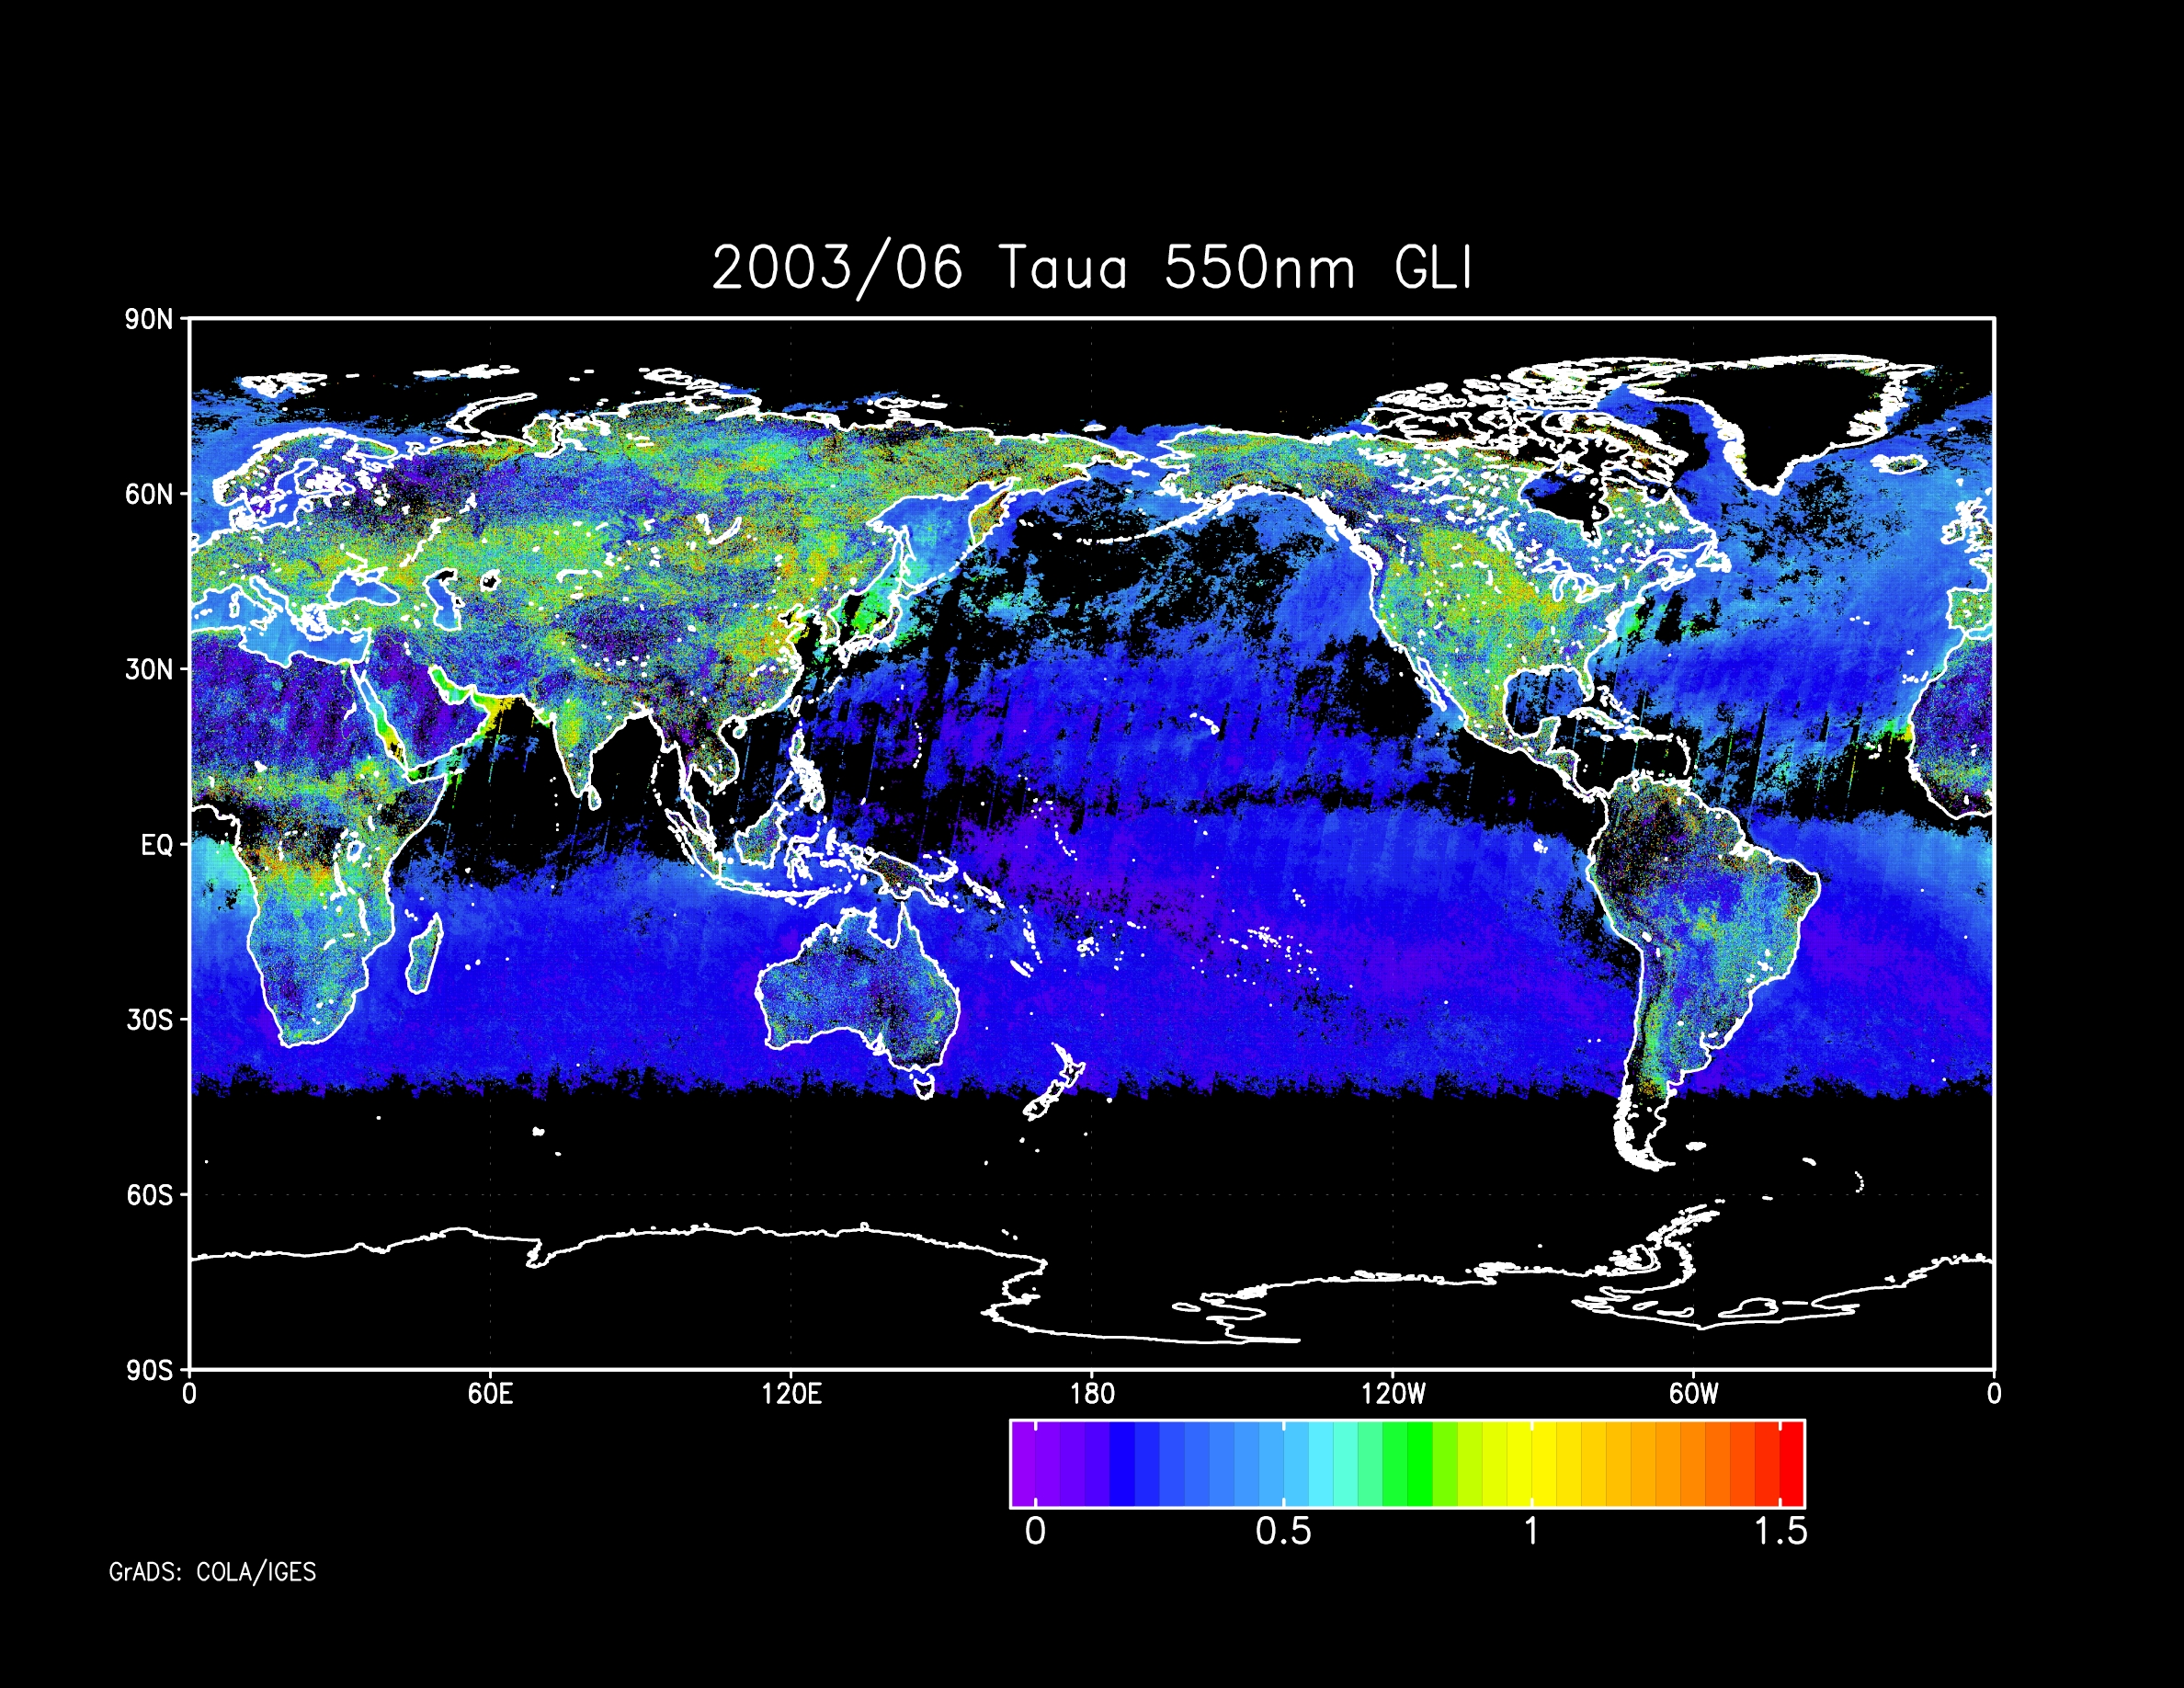
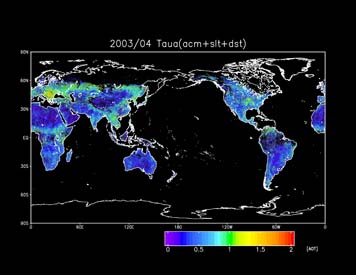
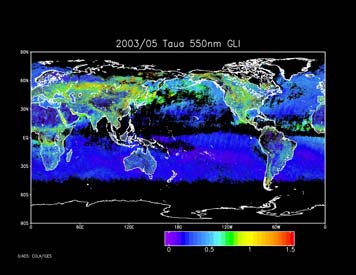
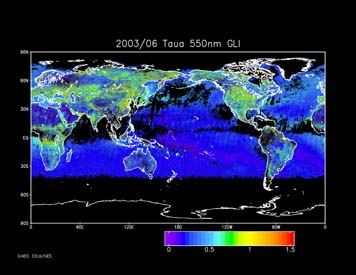
Aerosol optical thickness
of three mode aerosols and soot ratio
|
Tau-a (all) |
Tau-a (sea solt) |
Tau-a (dust) |
Tau-a (acc. mode) |
Tau-a (soot ratio) |
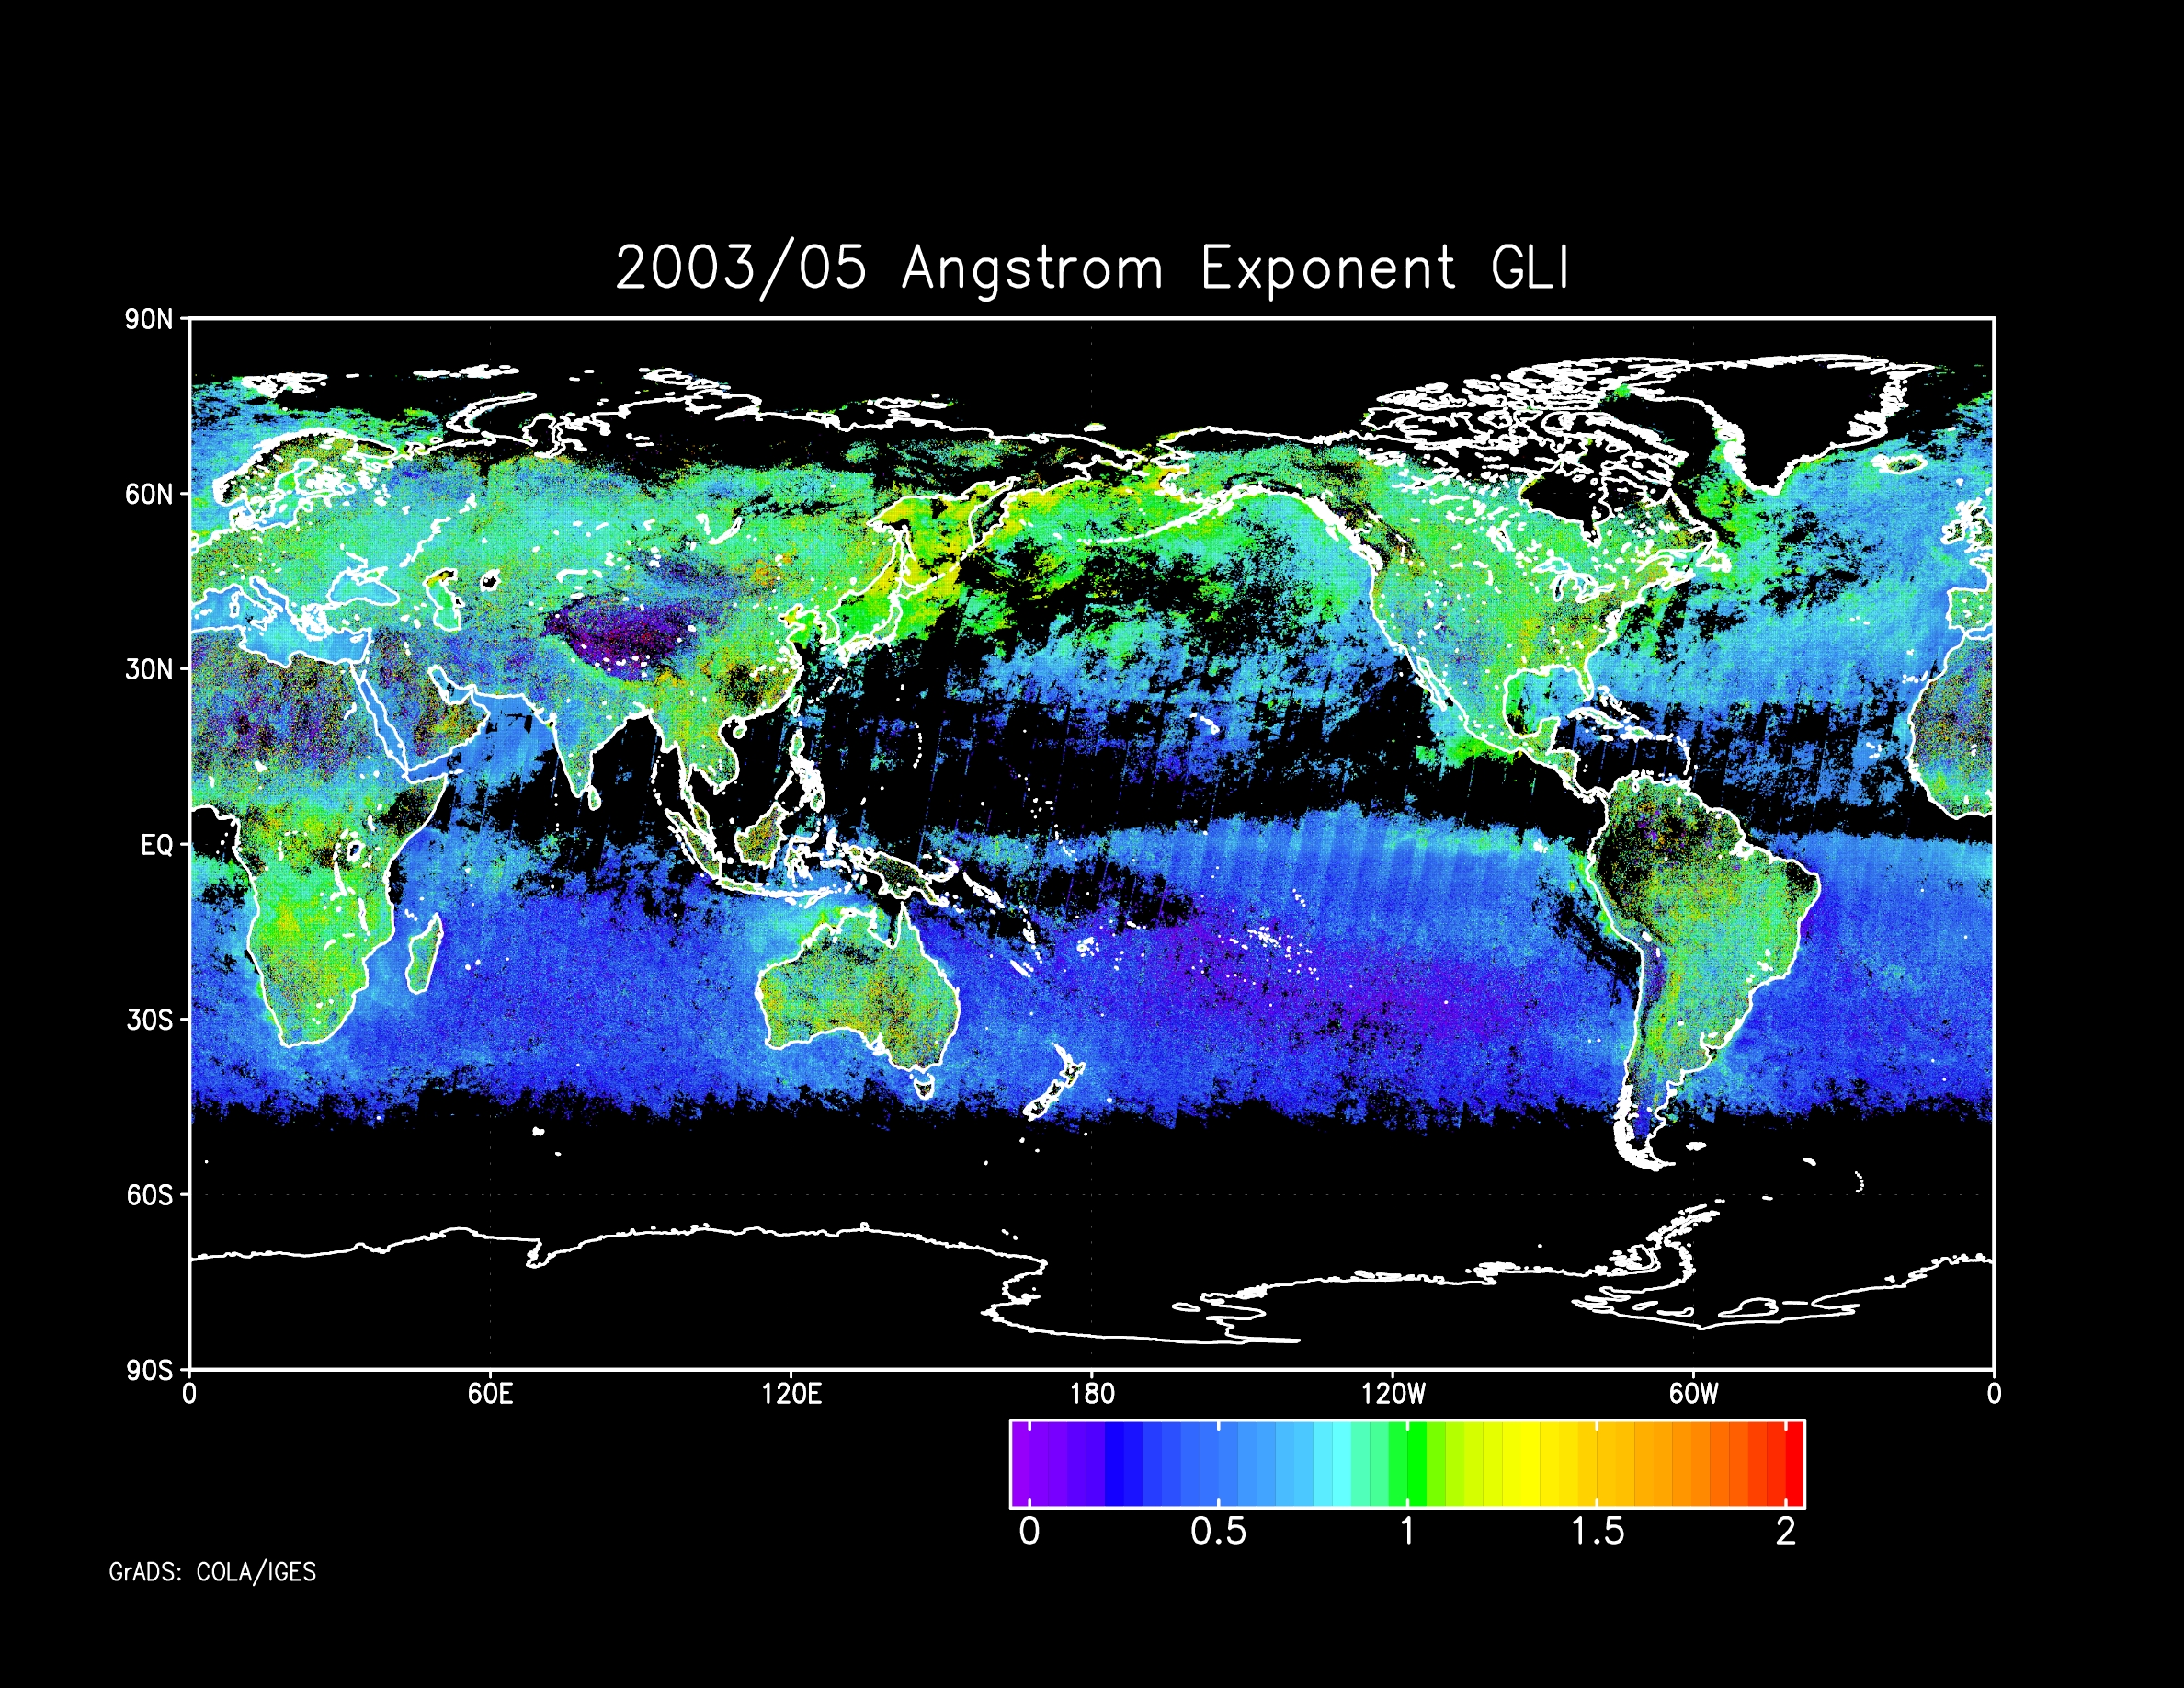
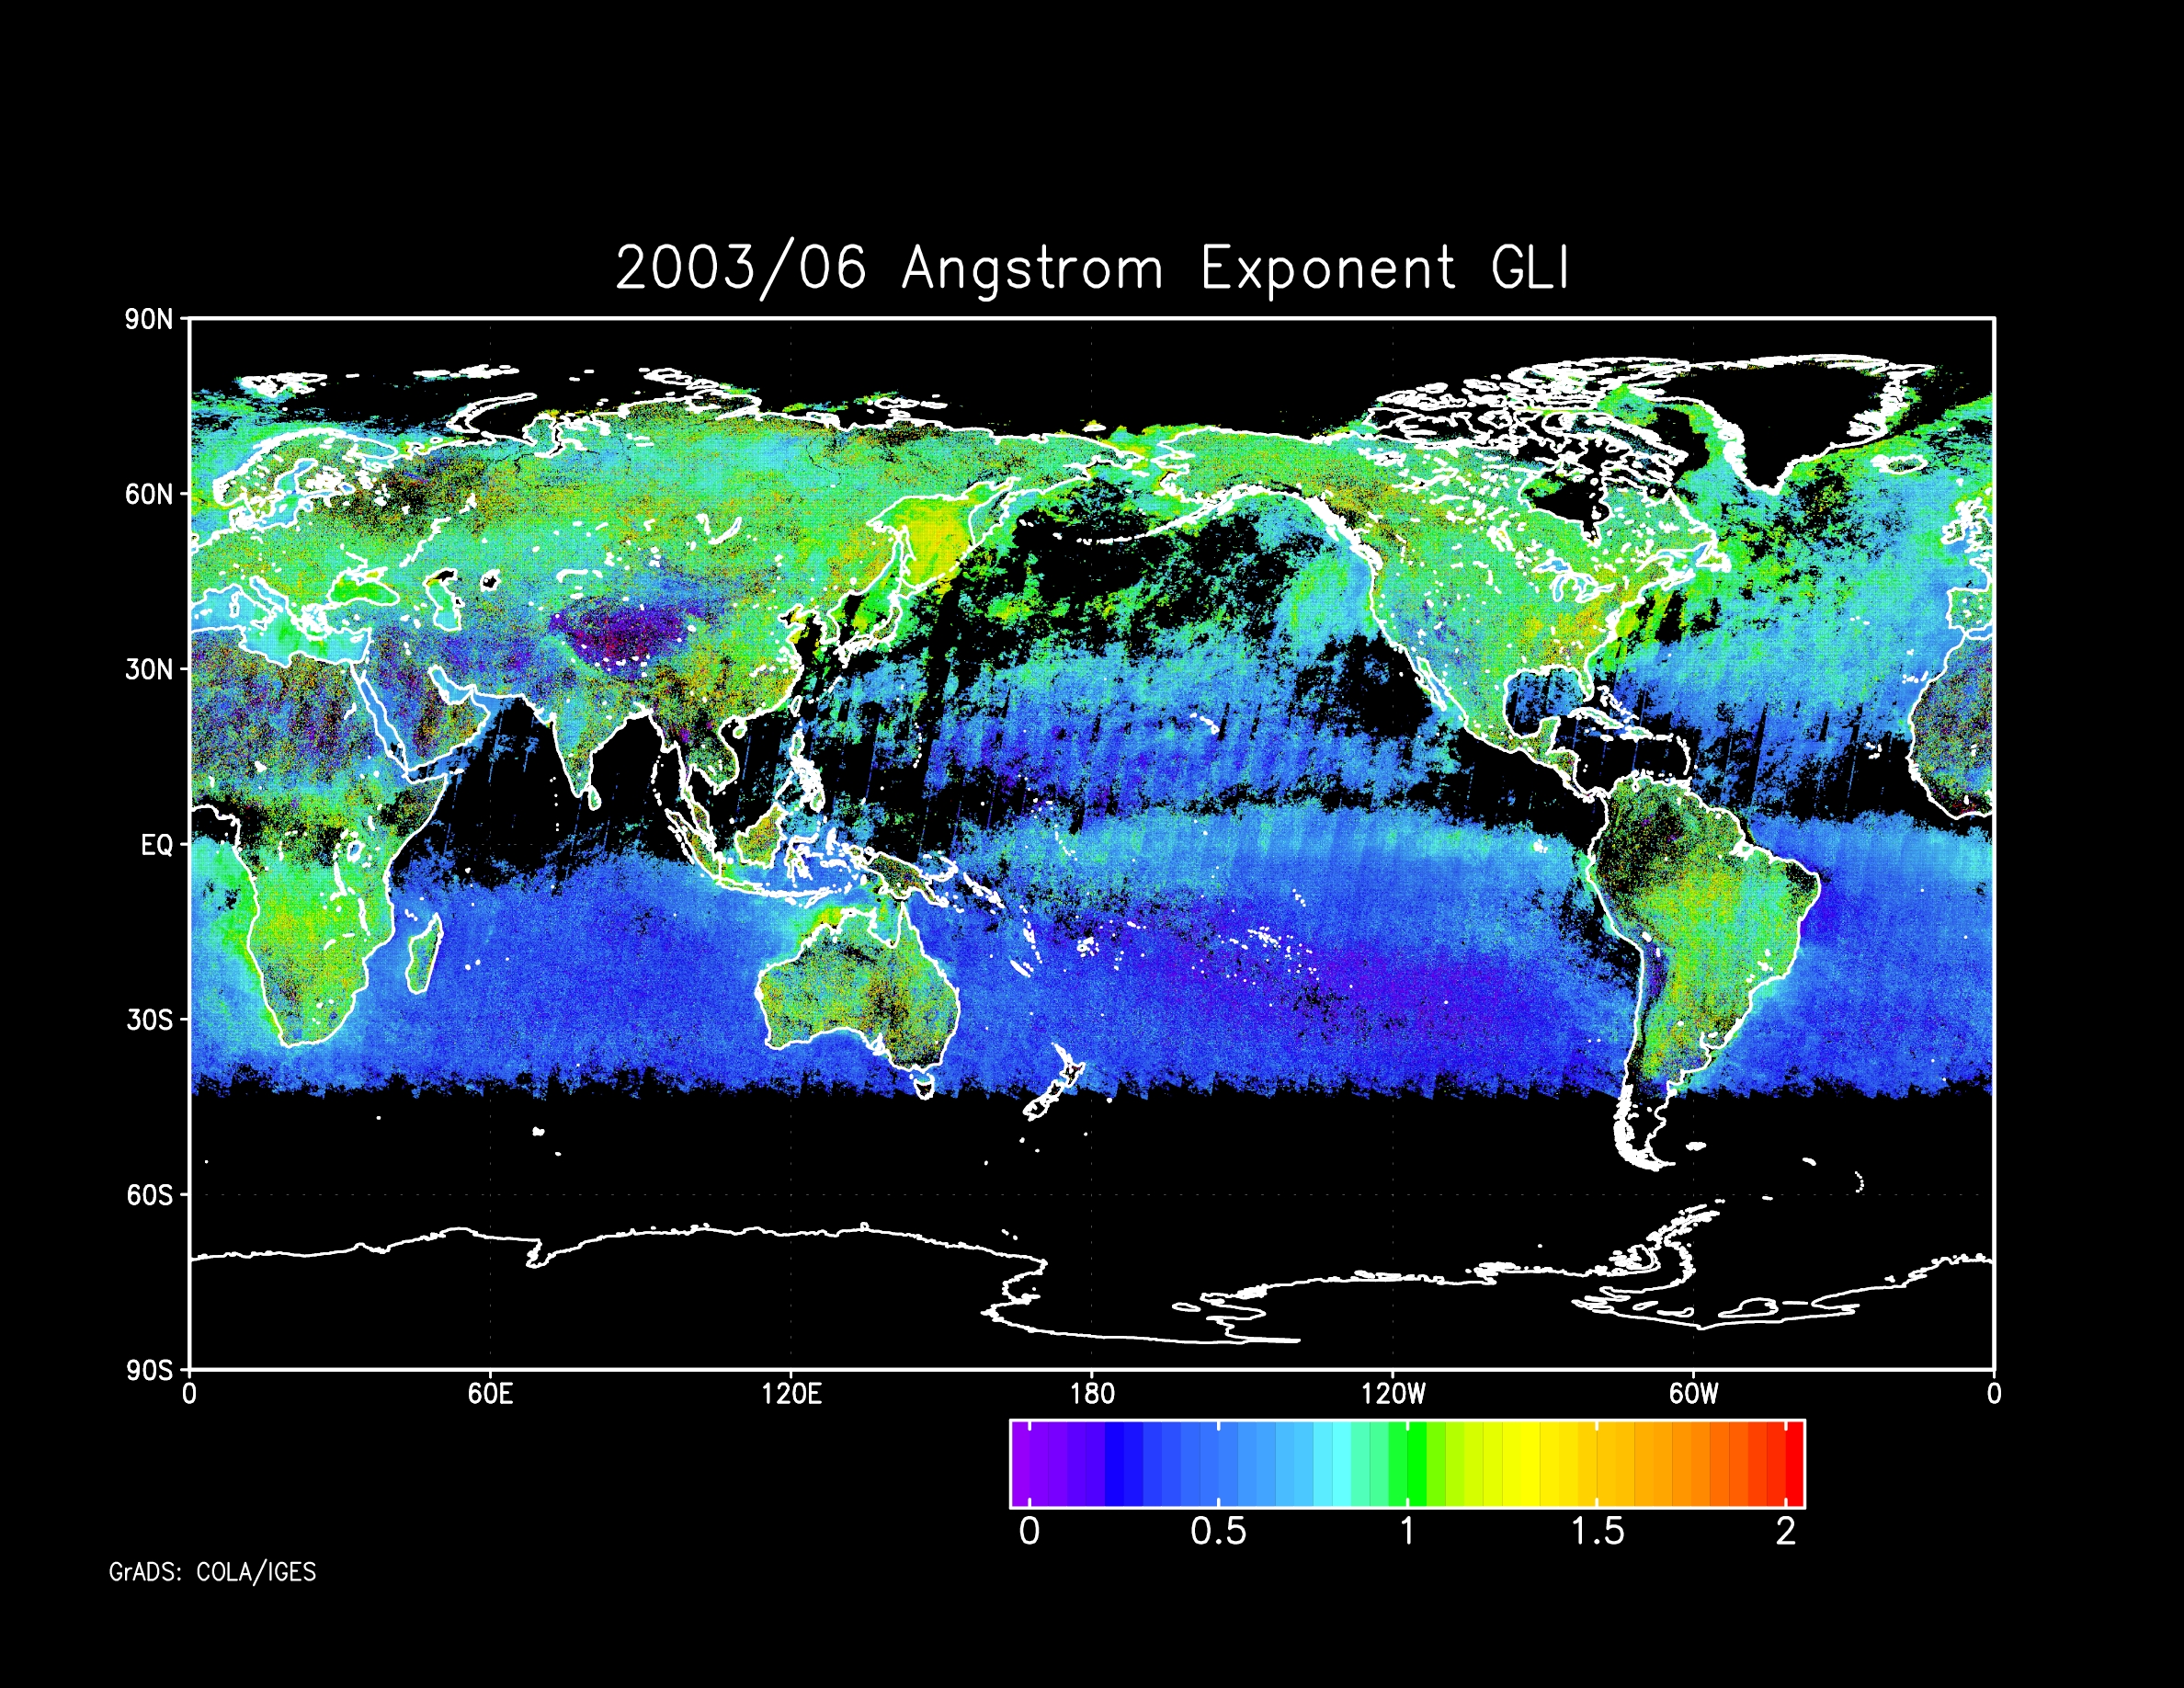
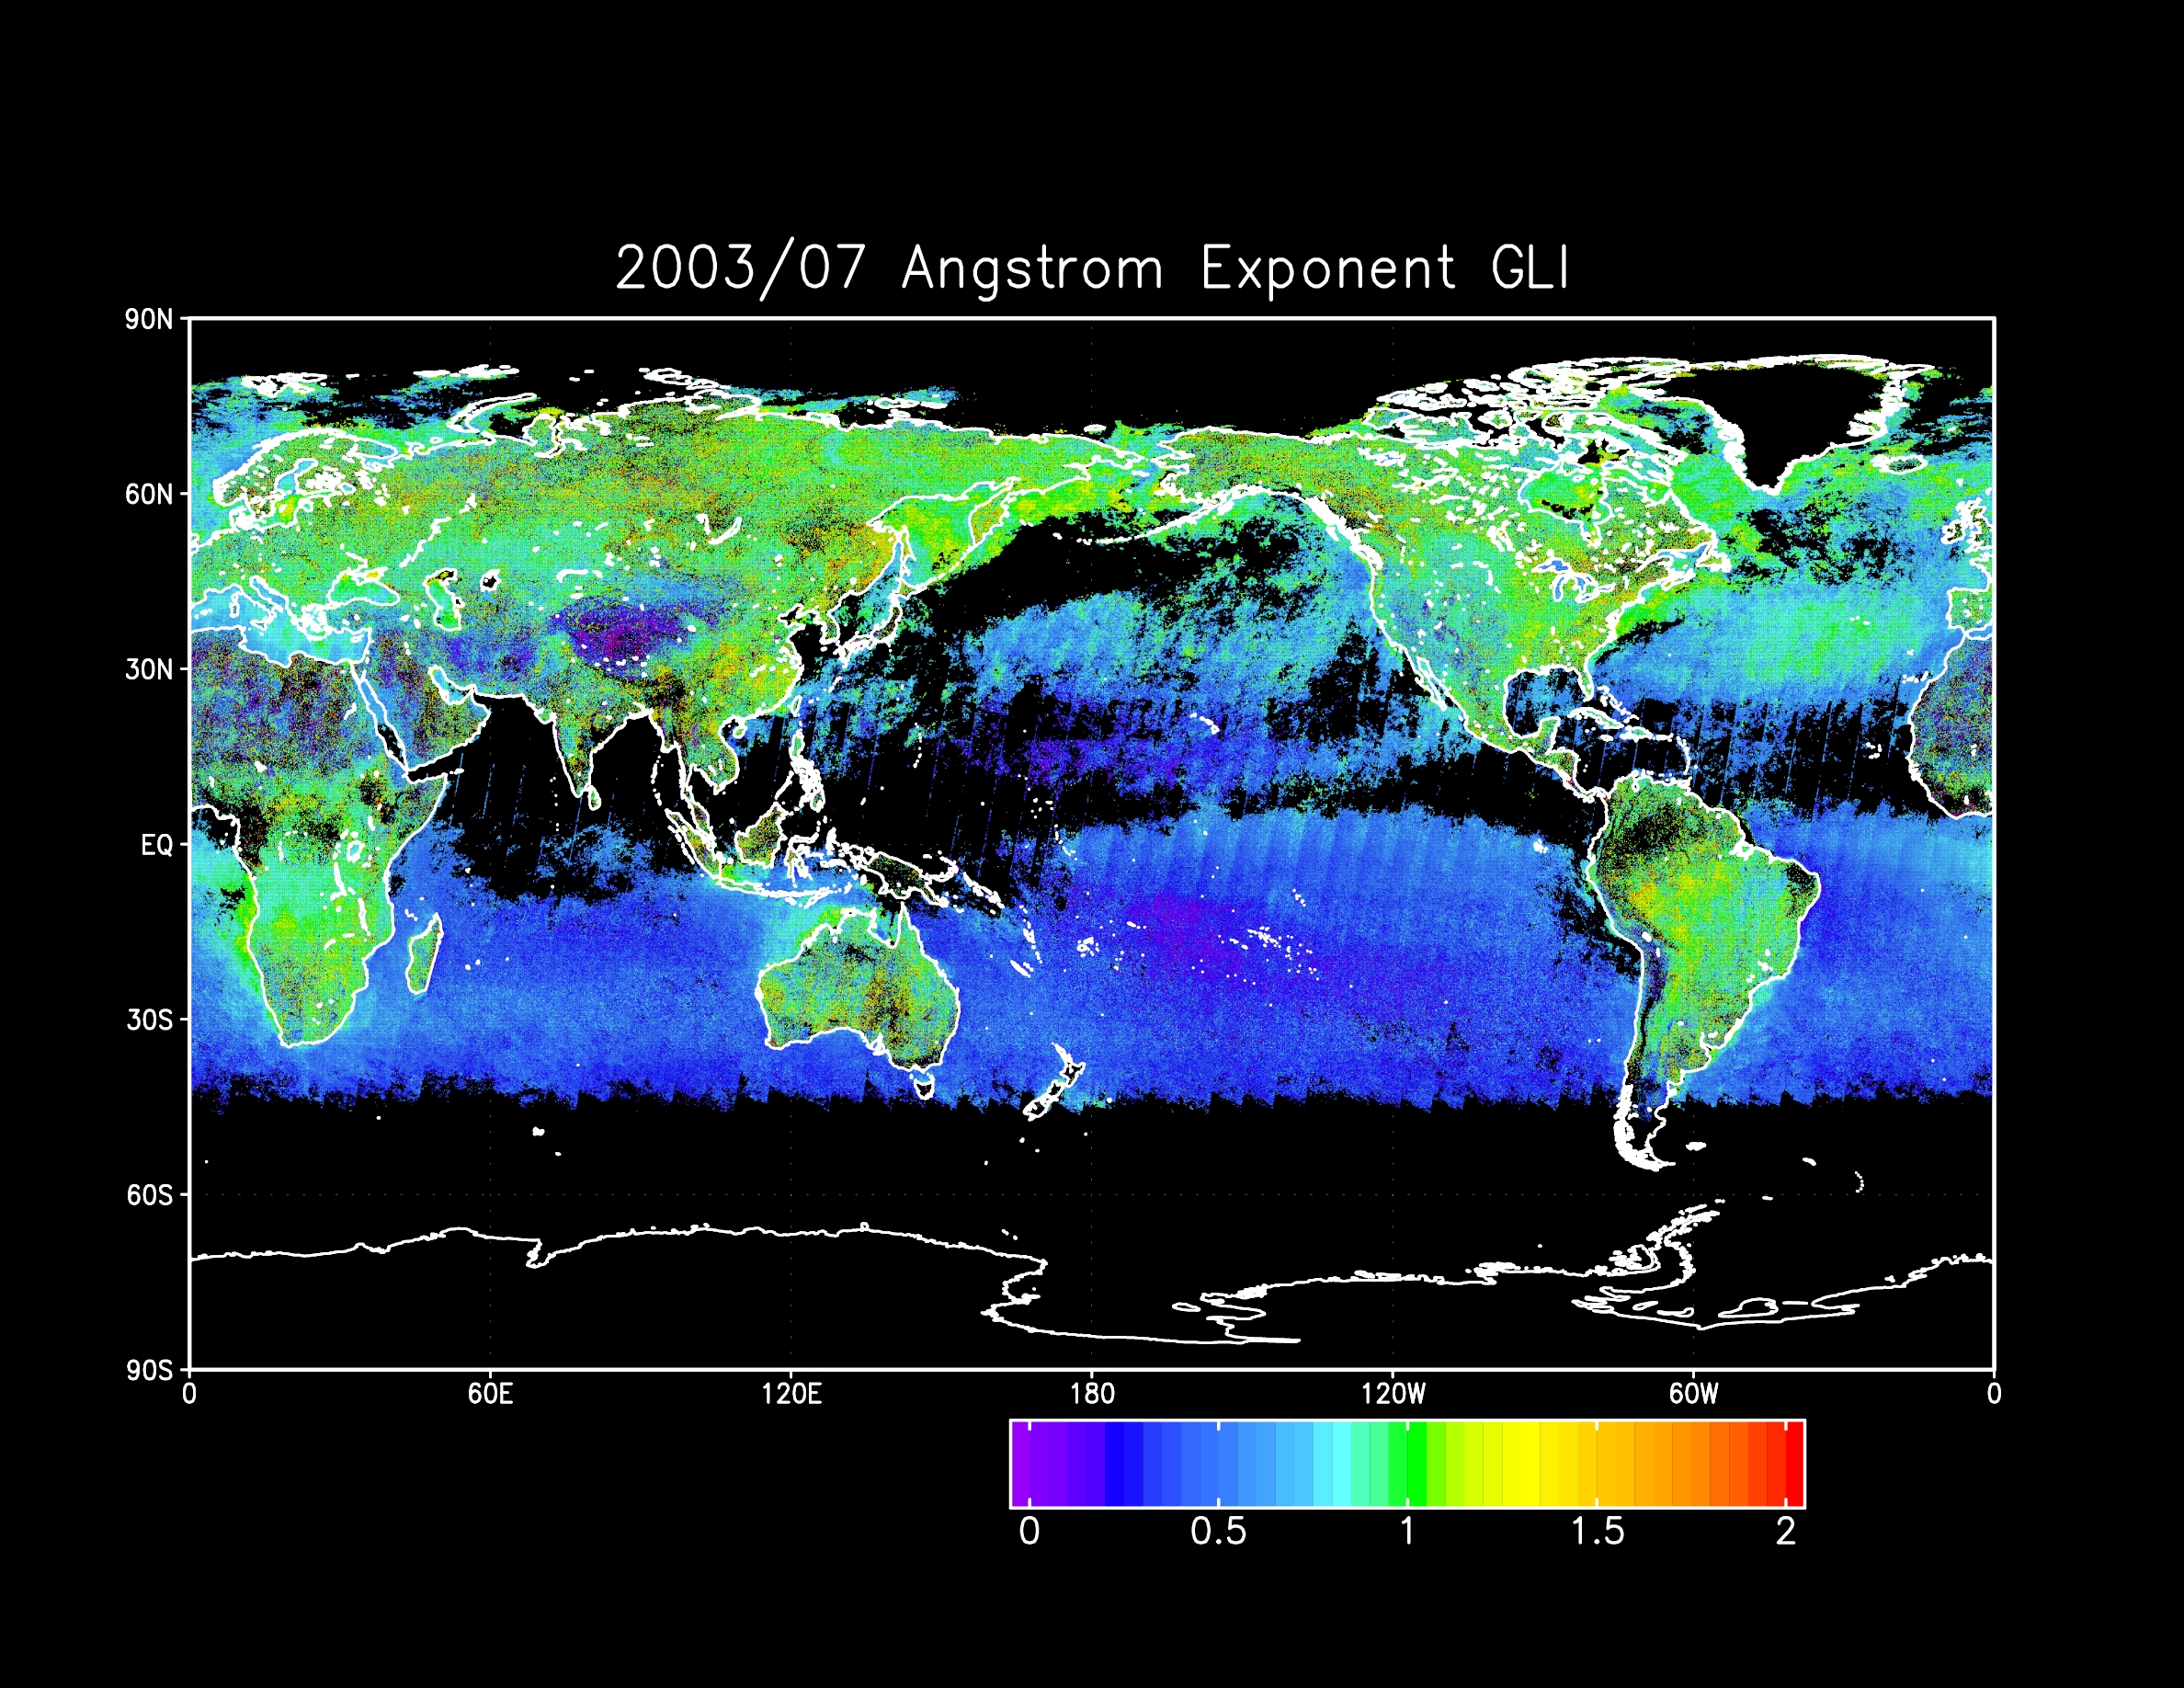
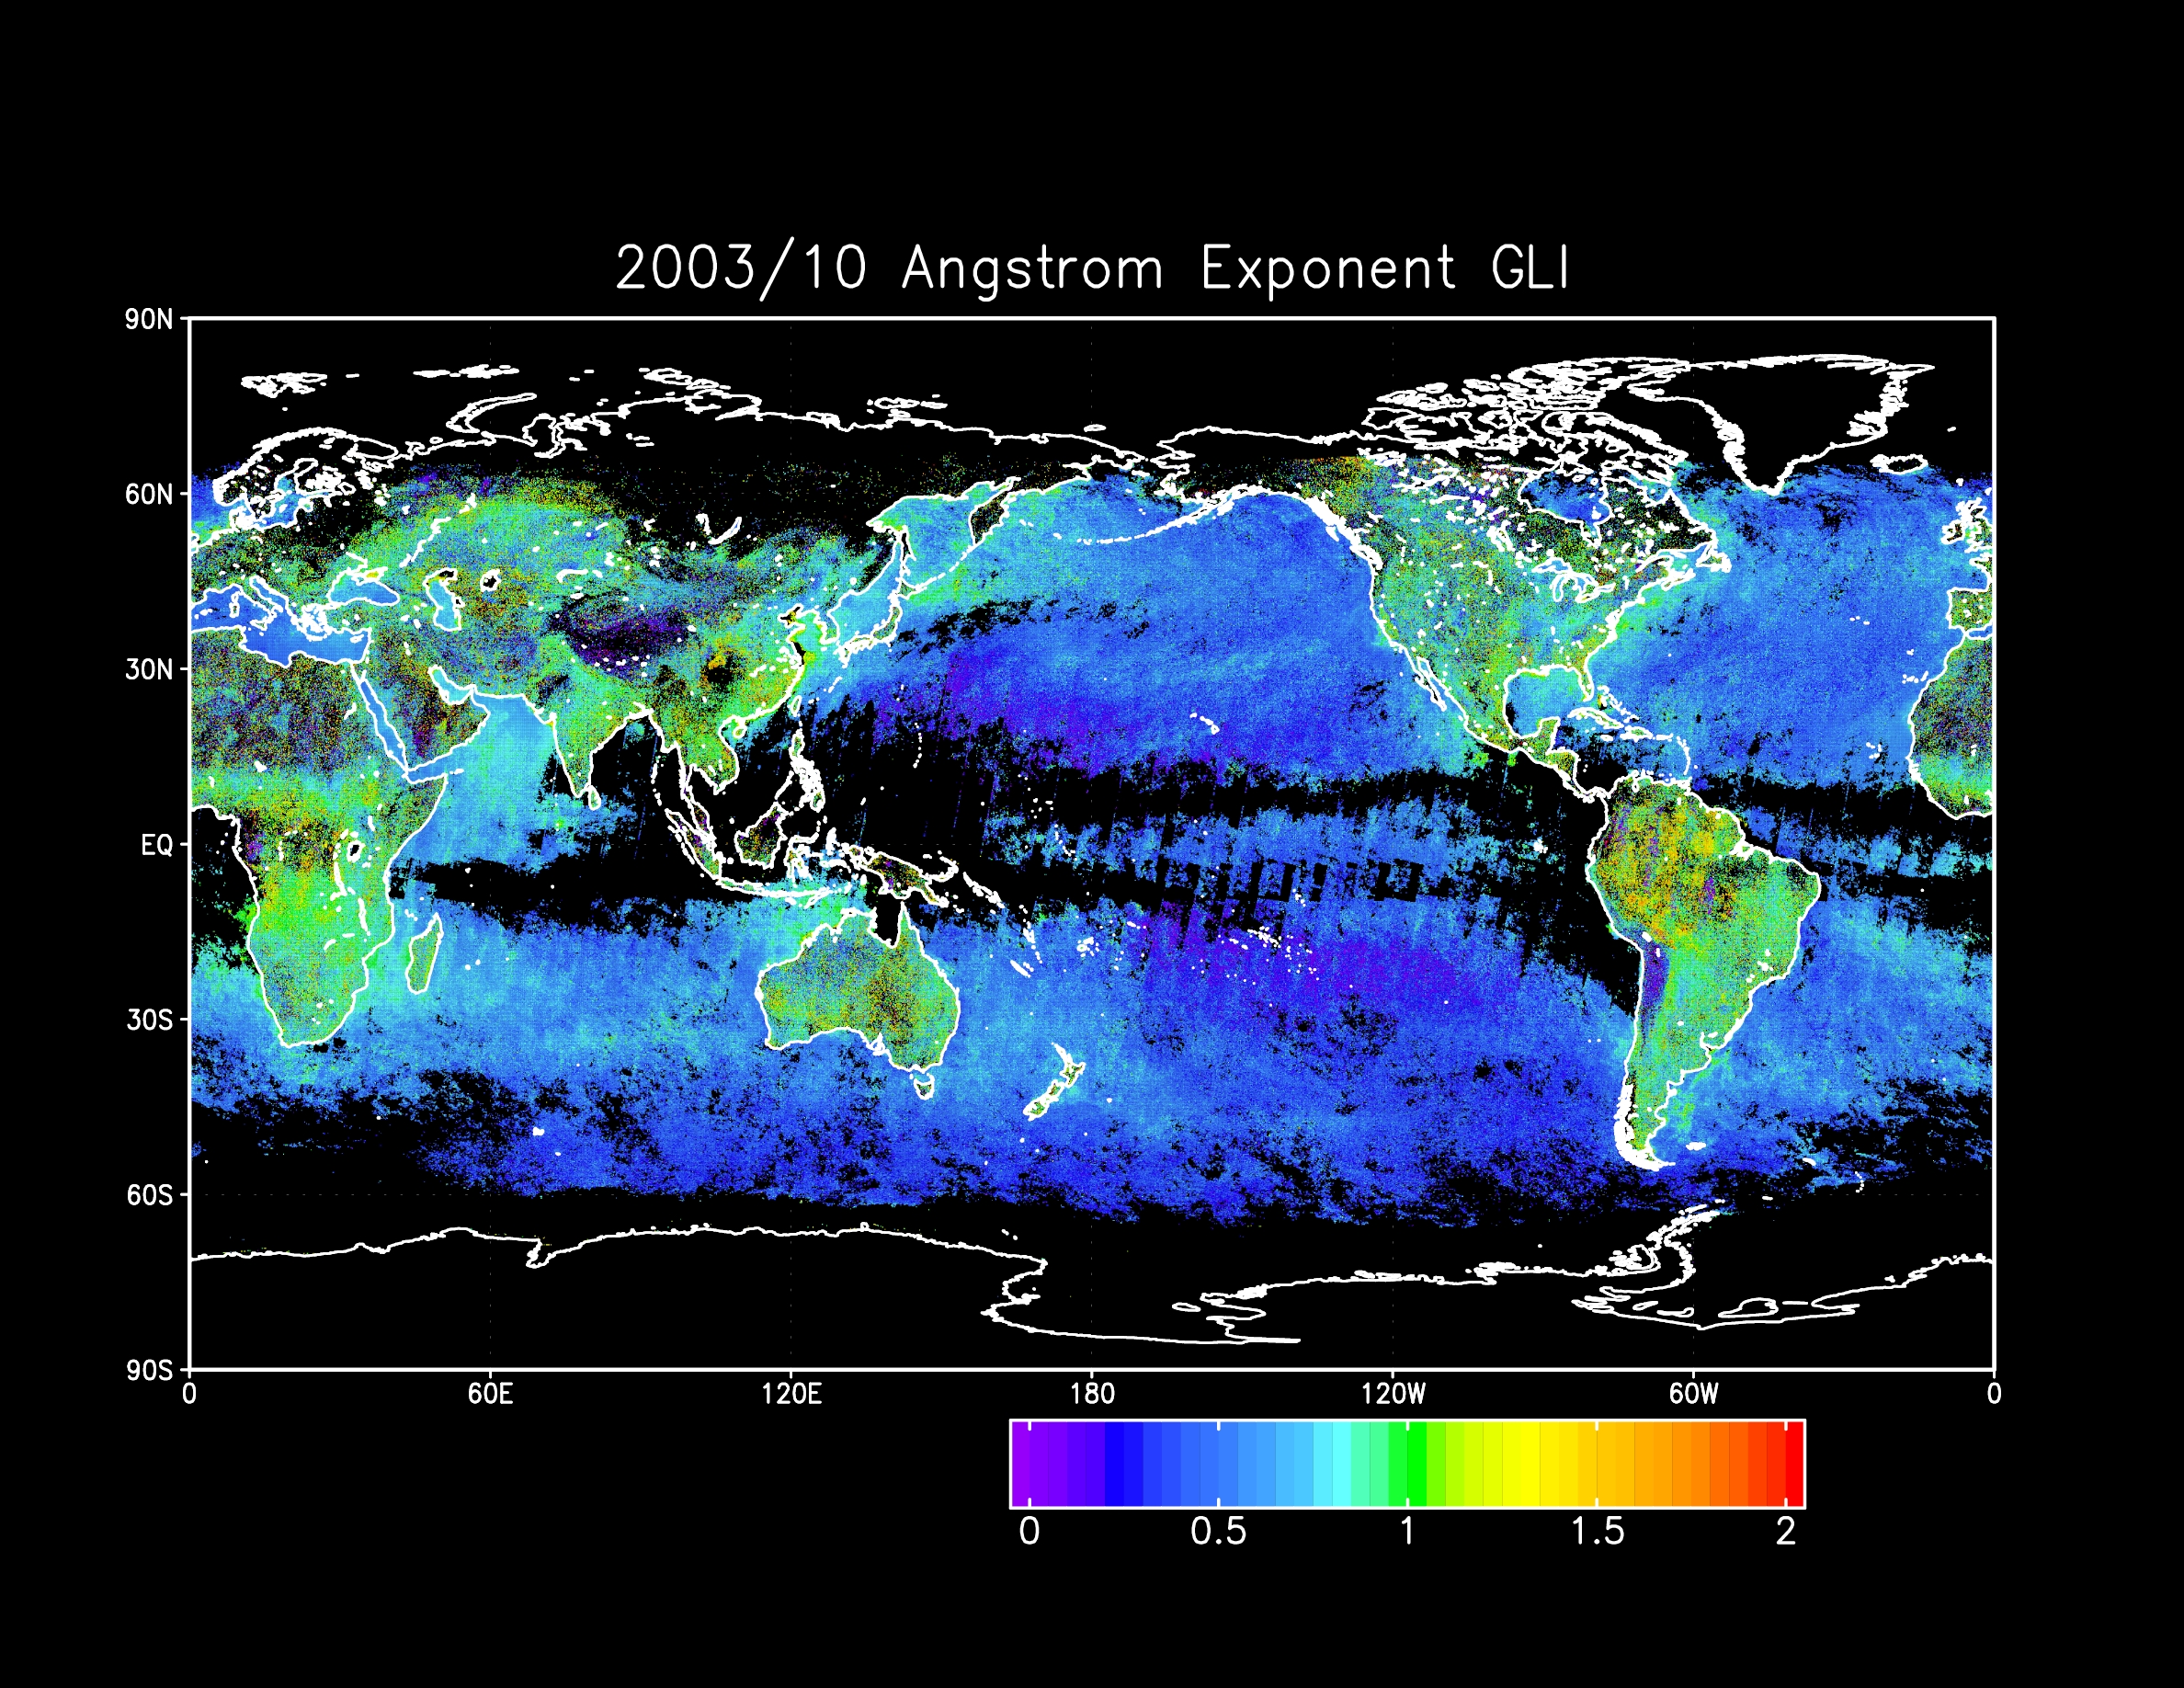
Angstrom exponent |
2003
Apr. |
 |
 |
 |
 |
 |
 |
2003
May. |
 |
 |
 |
 |
 |
 |
2003
Jun. |
 |
 |
 |
 |
 |
 |
2003
Jul. |
 |
 |
 |
 |
 |
 |
2003
Aug. |
 |
 |
 |
 |
 |
 |
2003
Sep. |
 |
 |
 |
 |
 |
 |
2003
Oct. |
 |
 |
 |
 |
 |
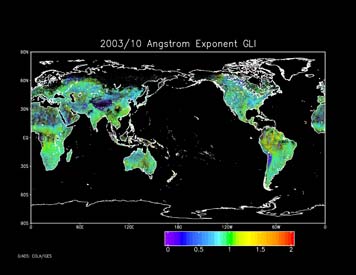 |
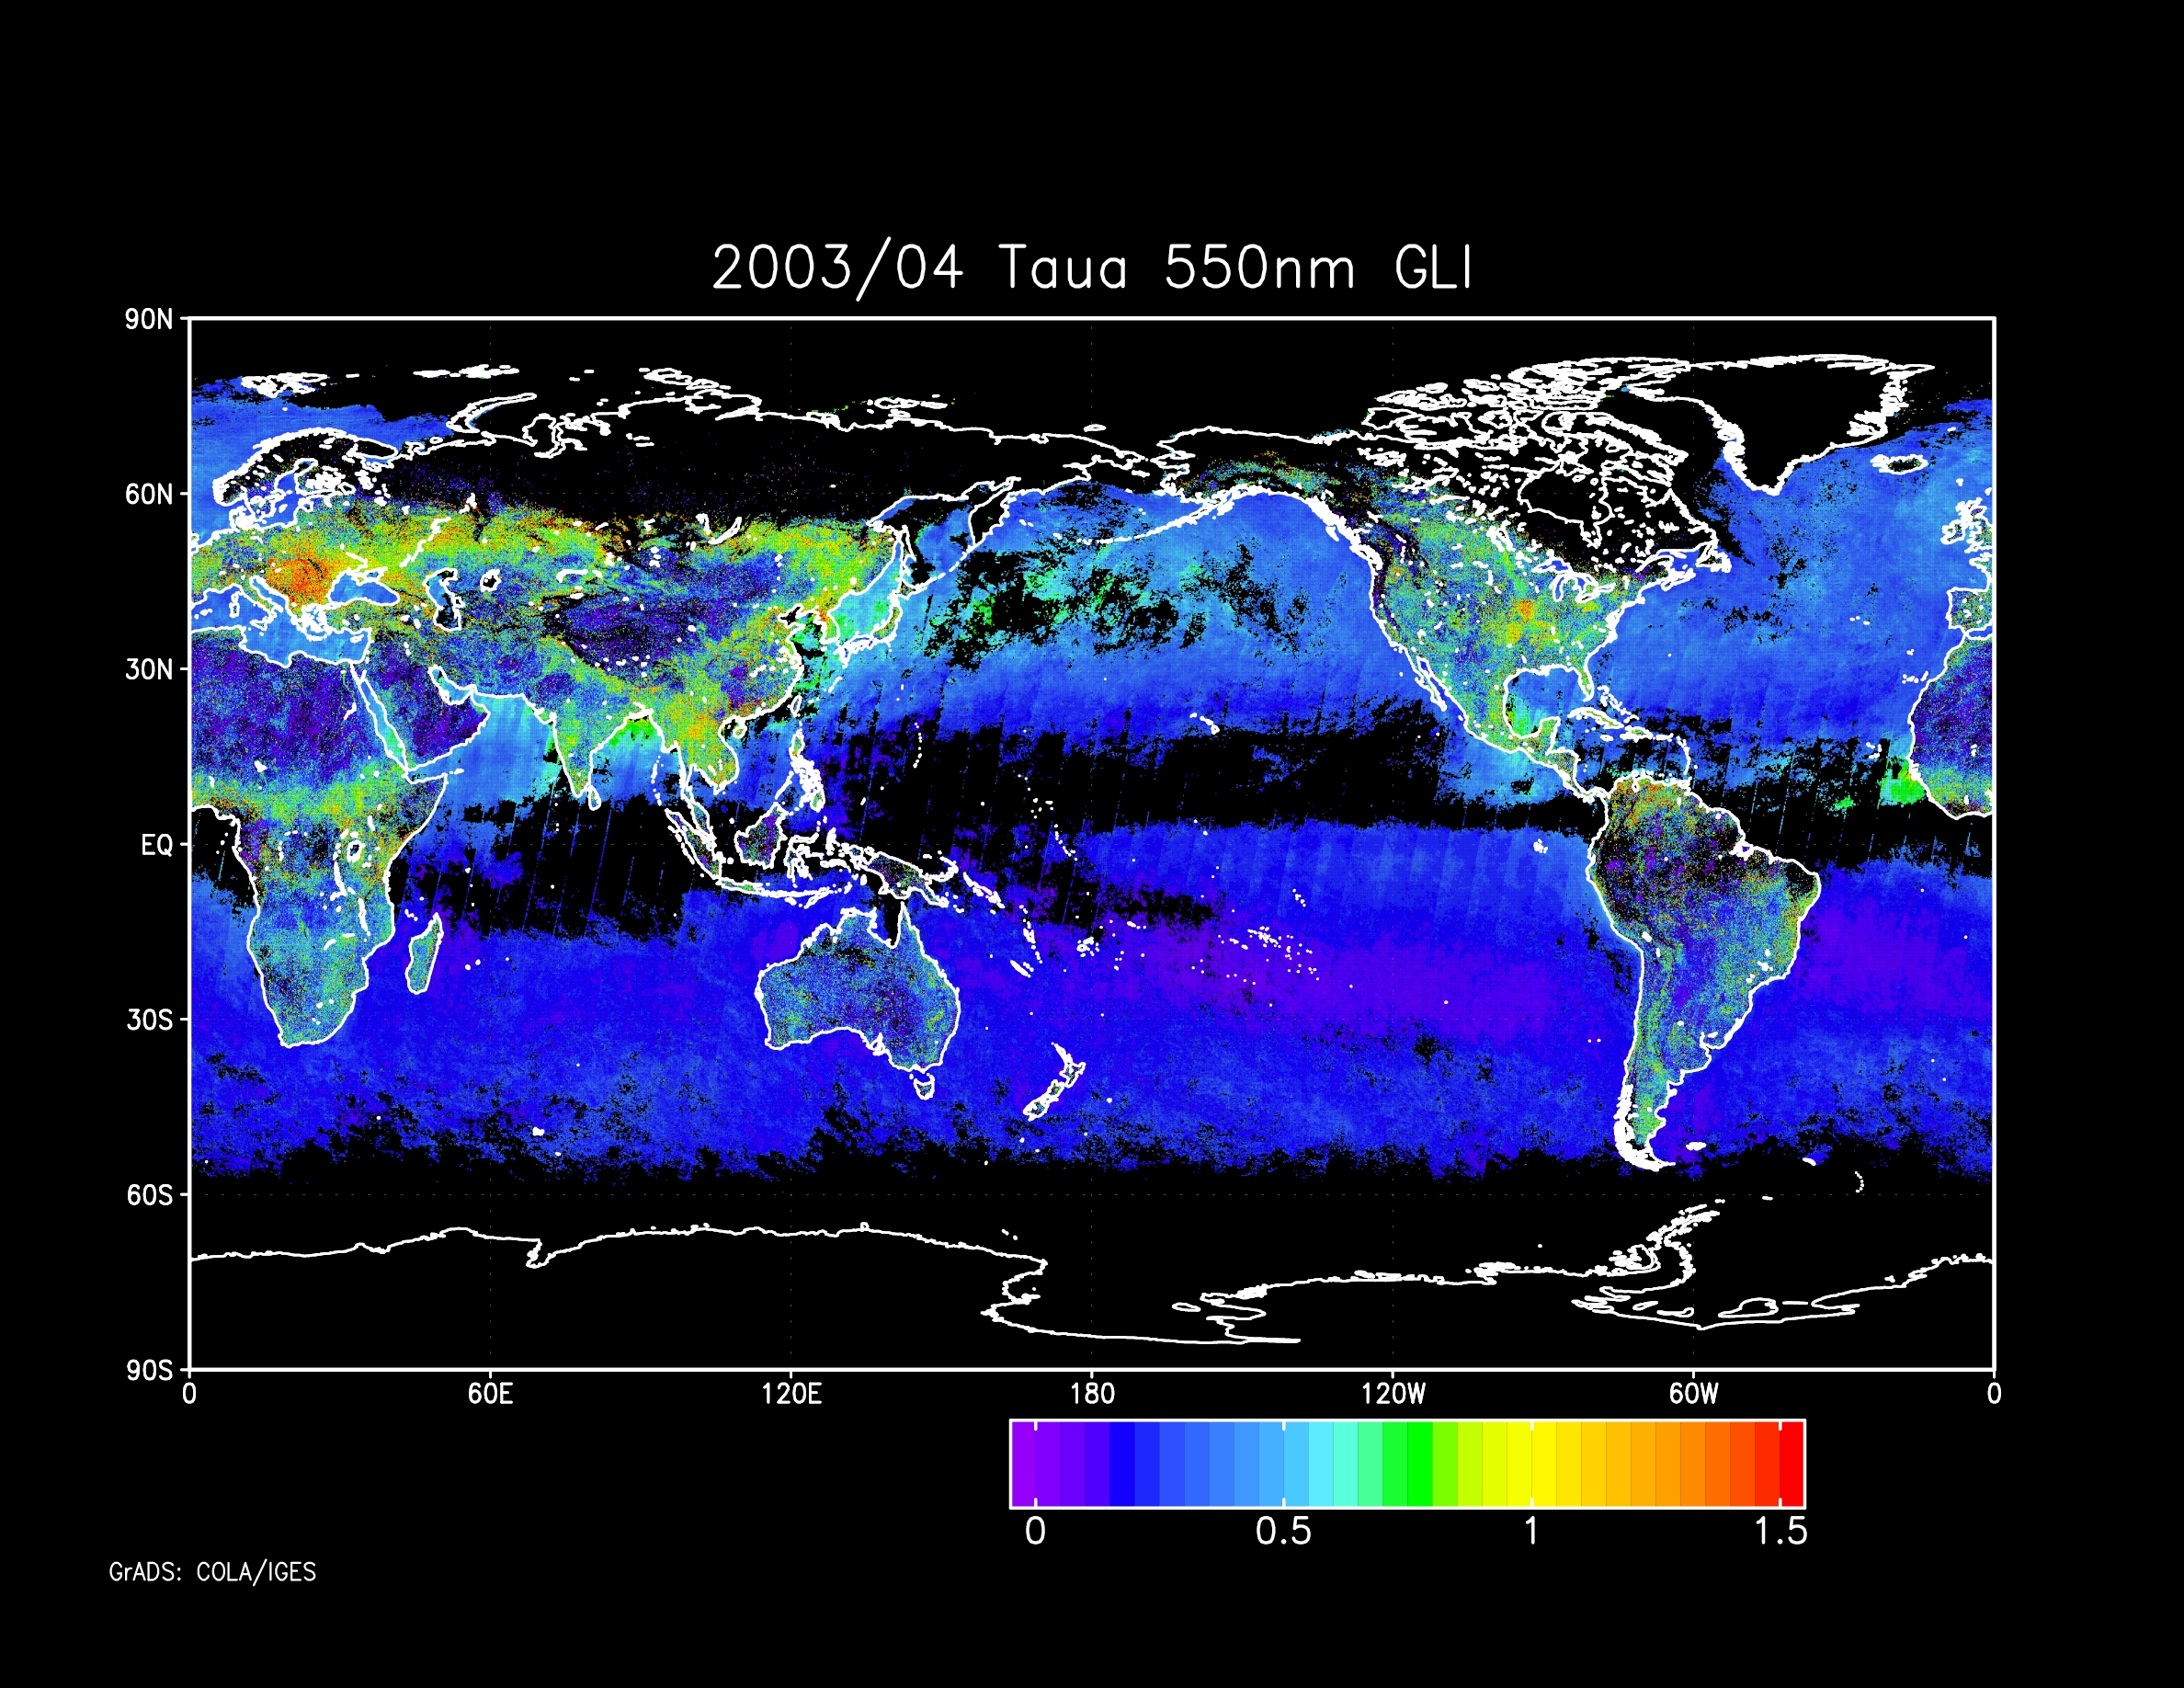
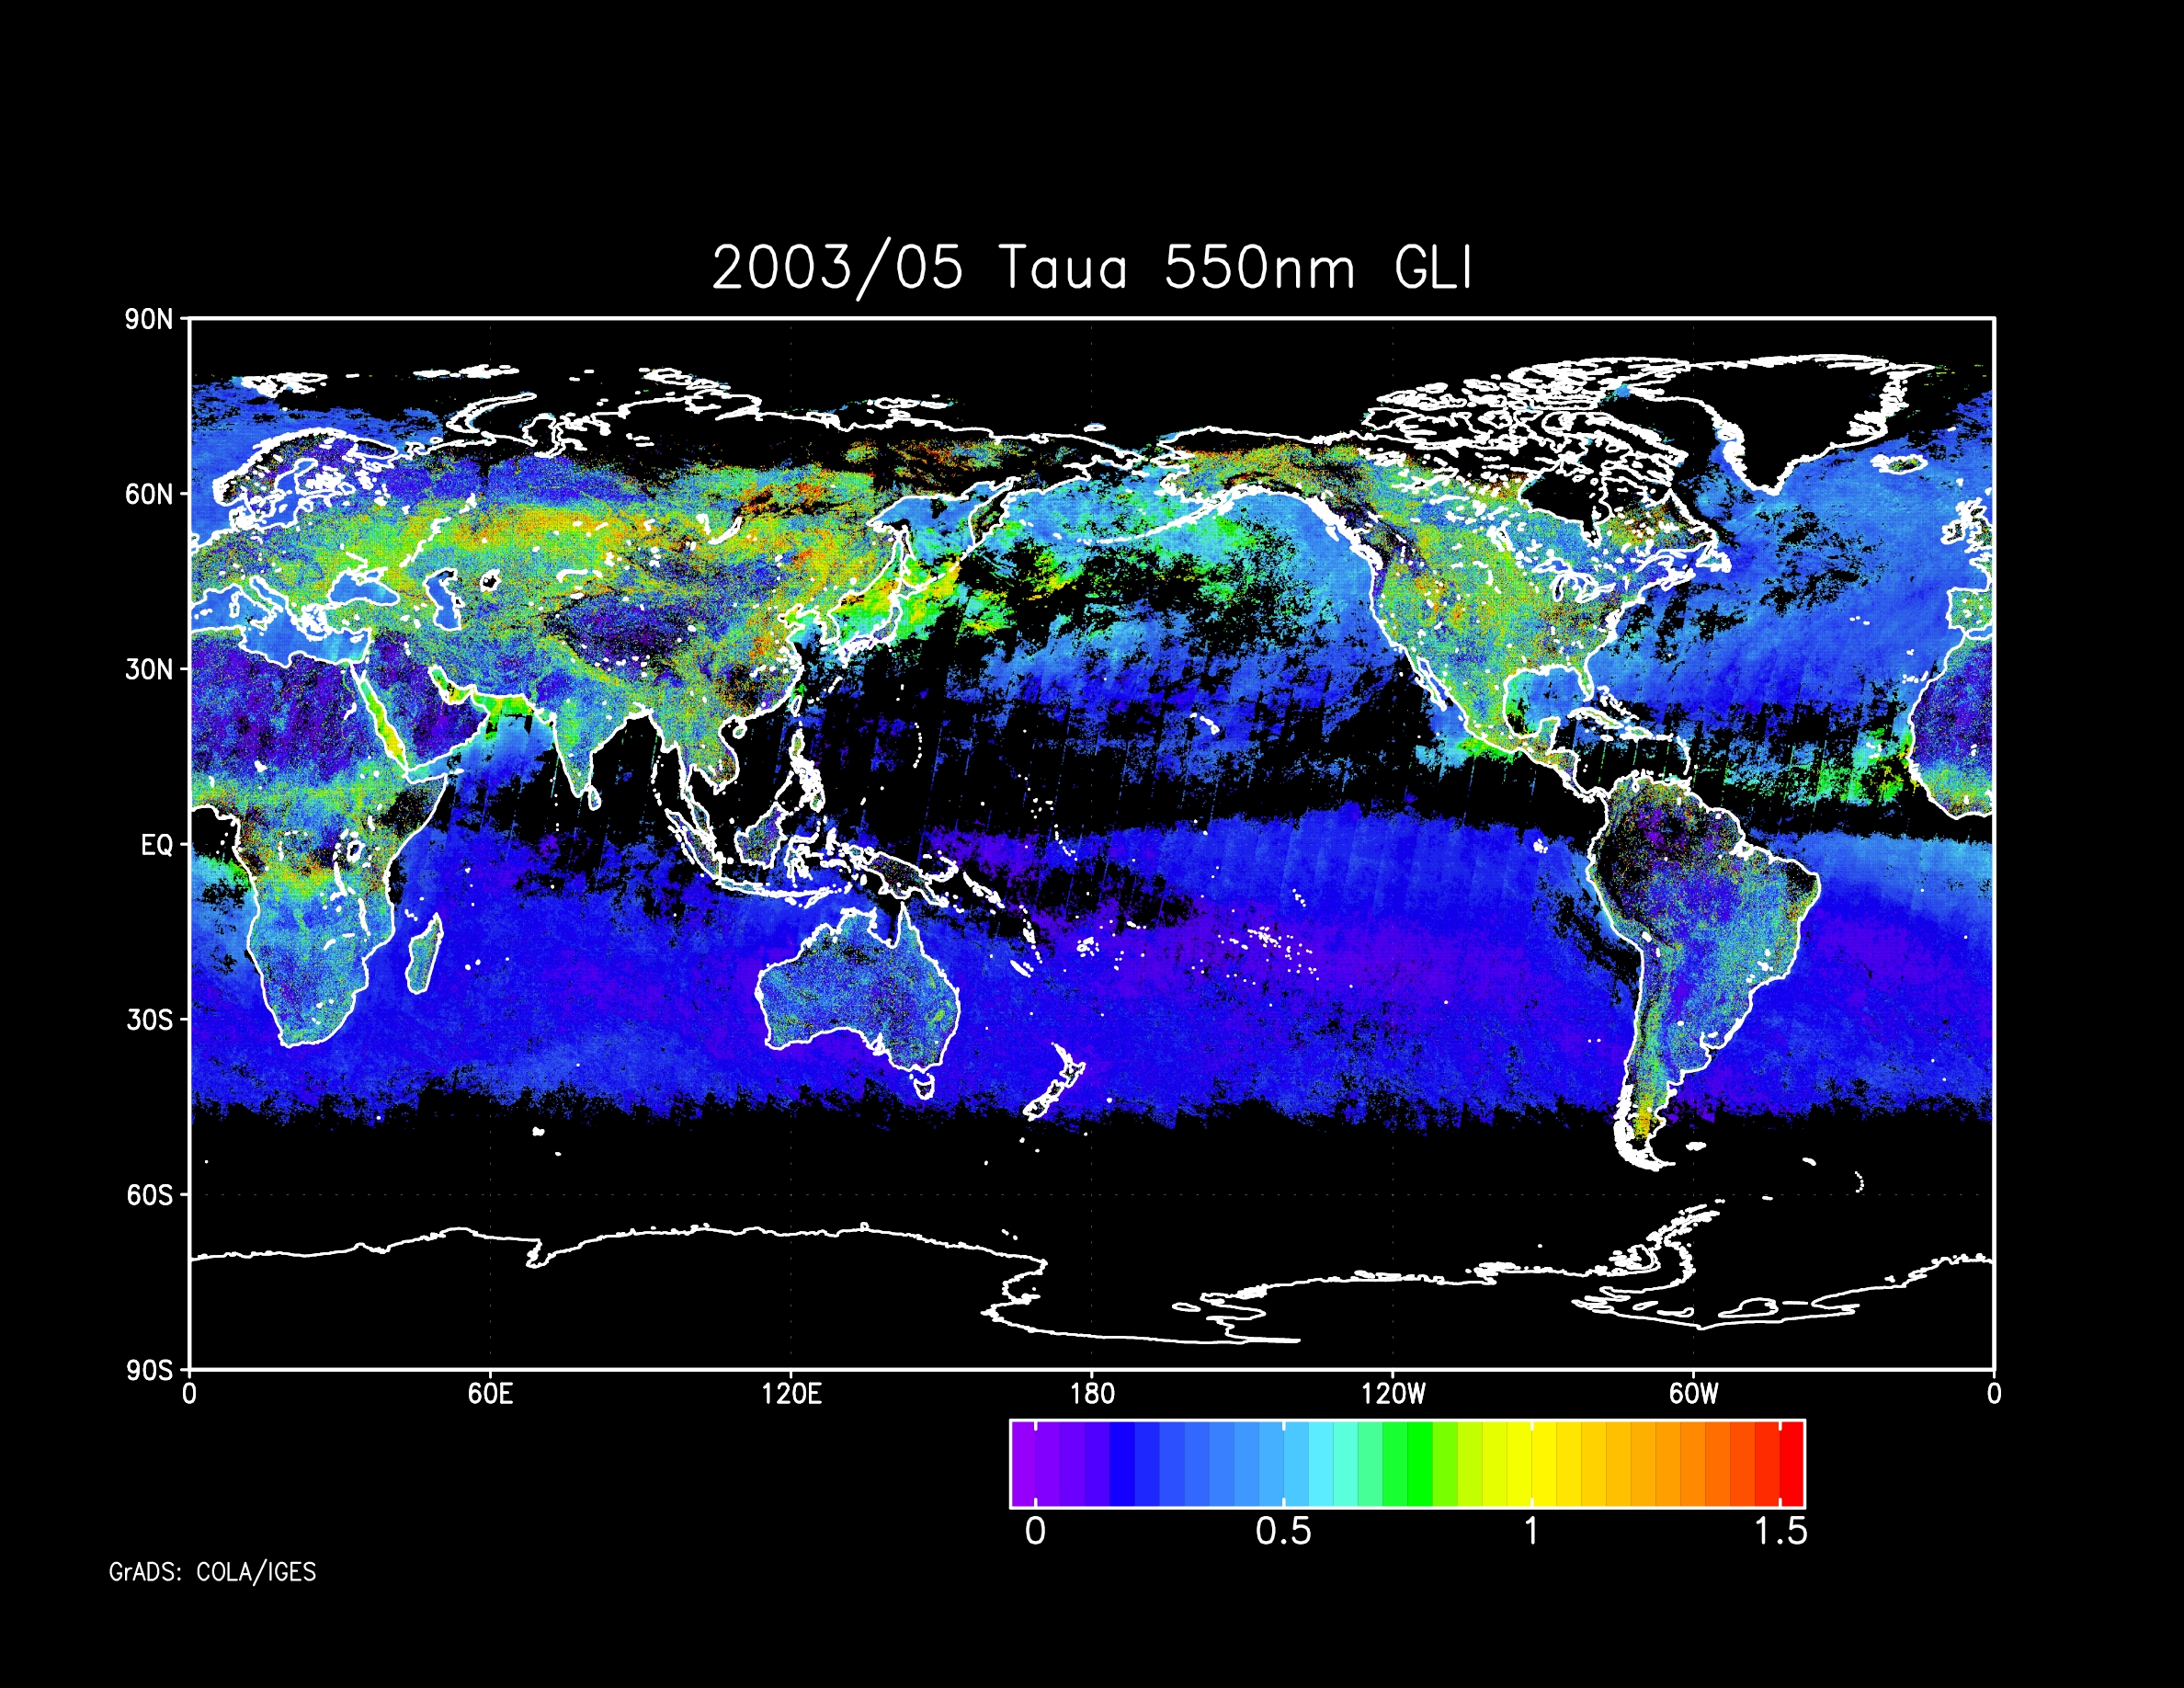
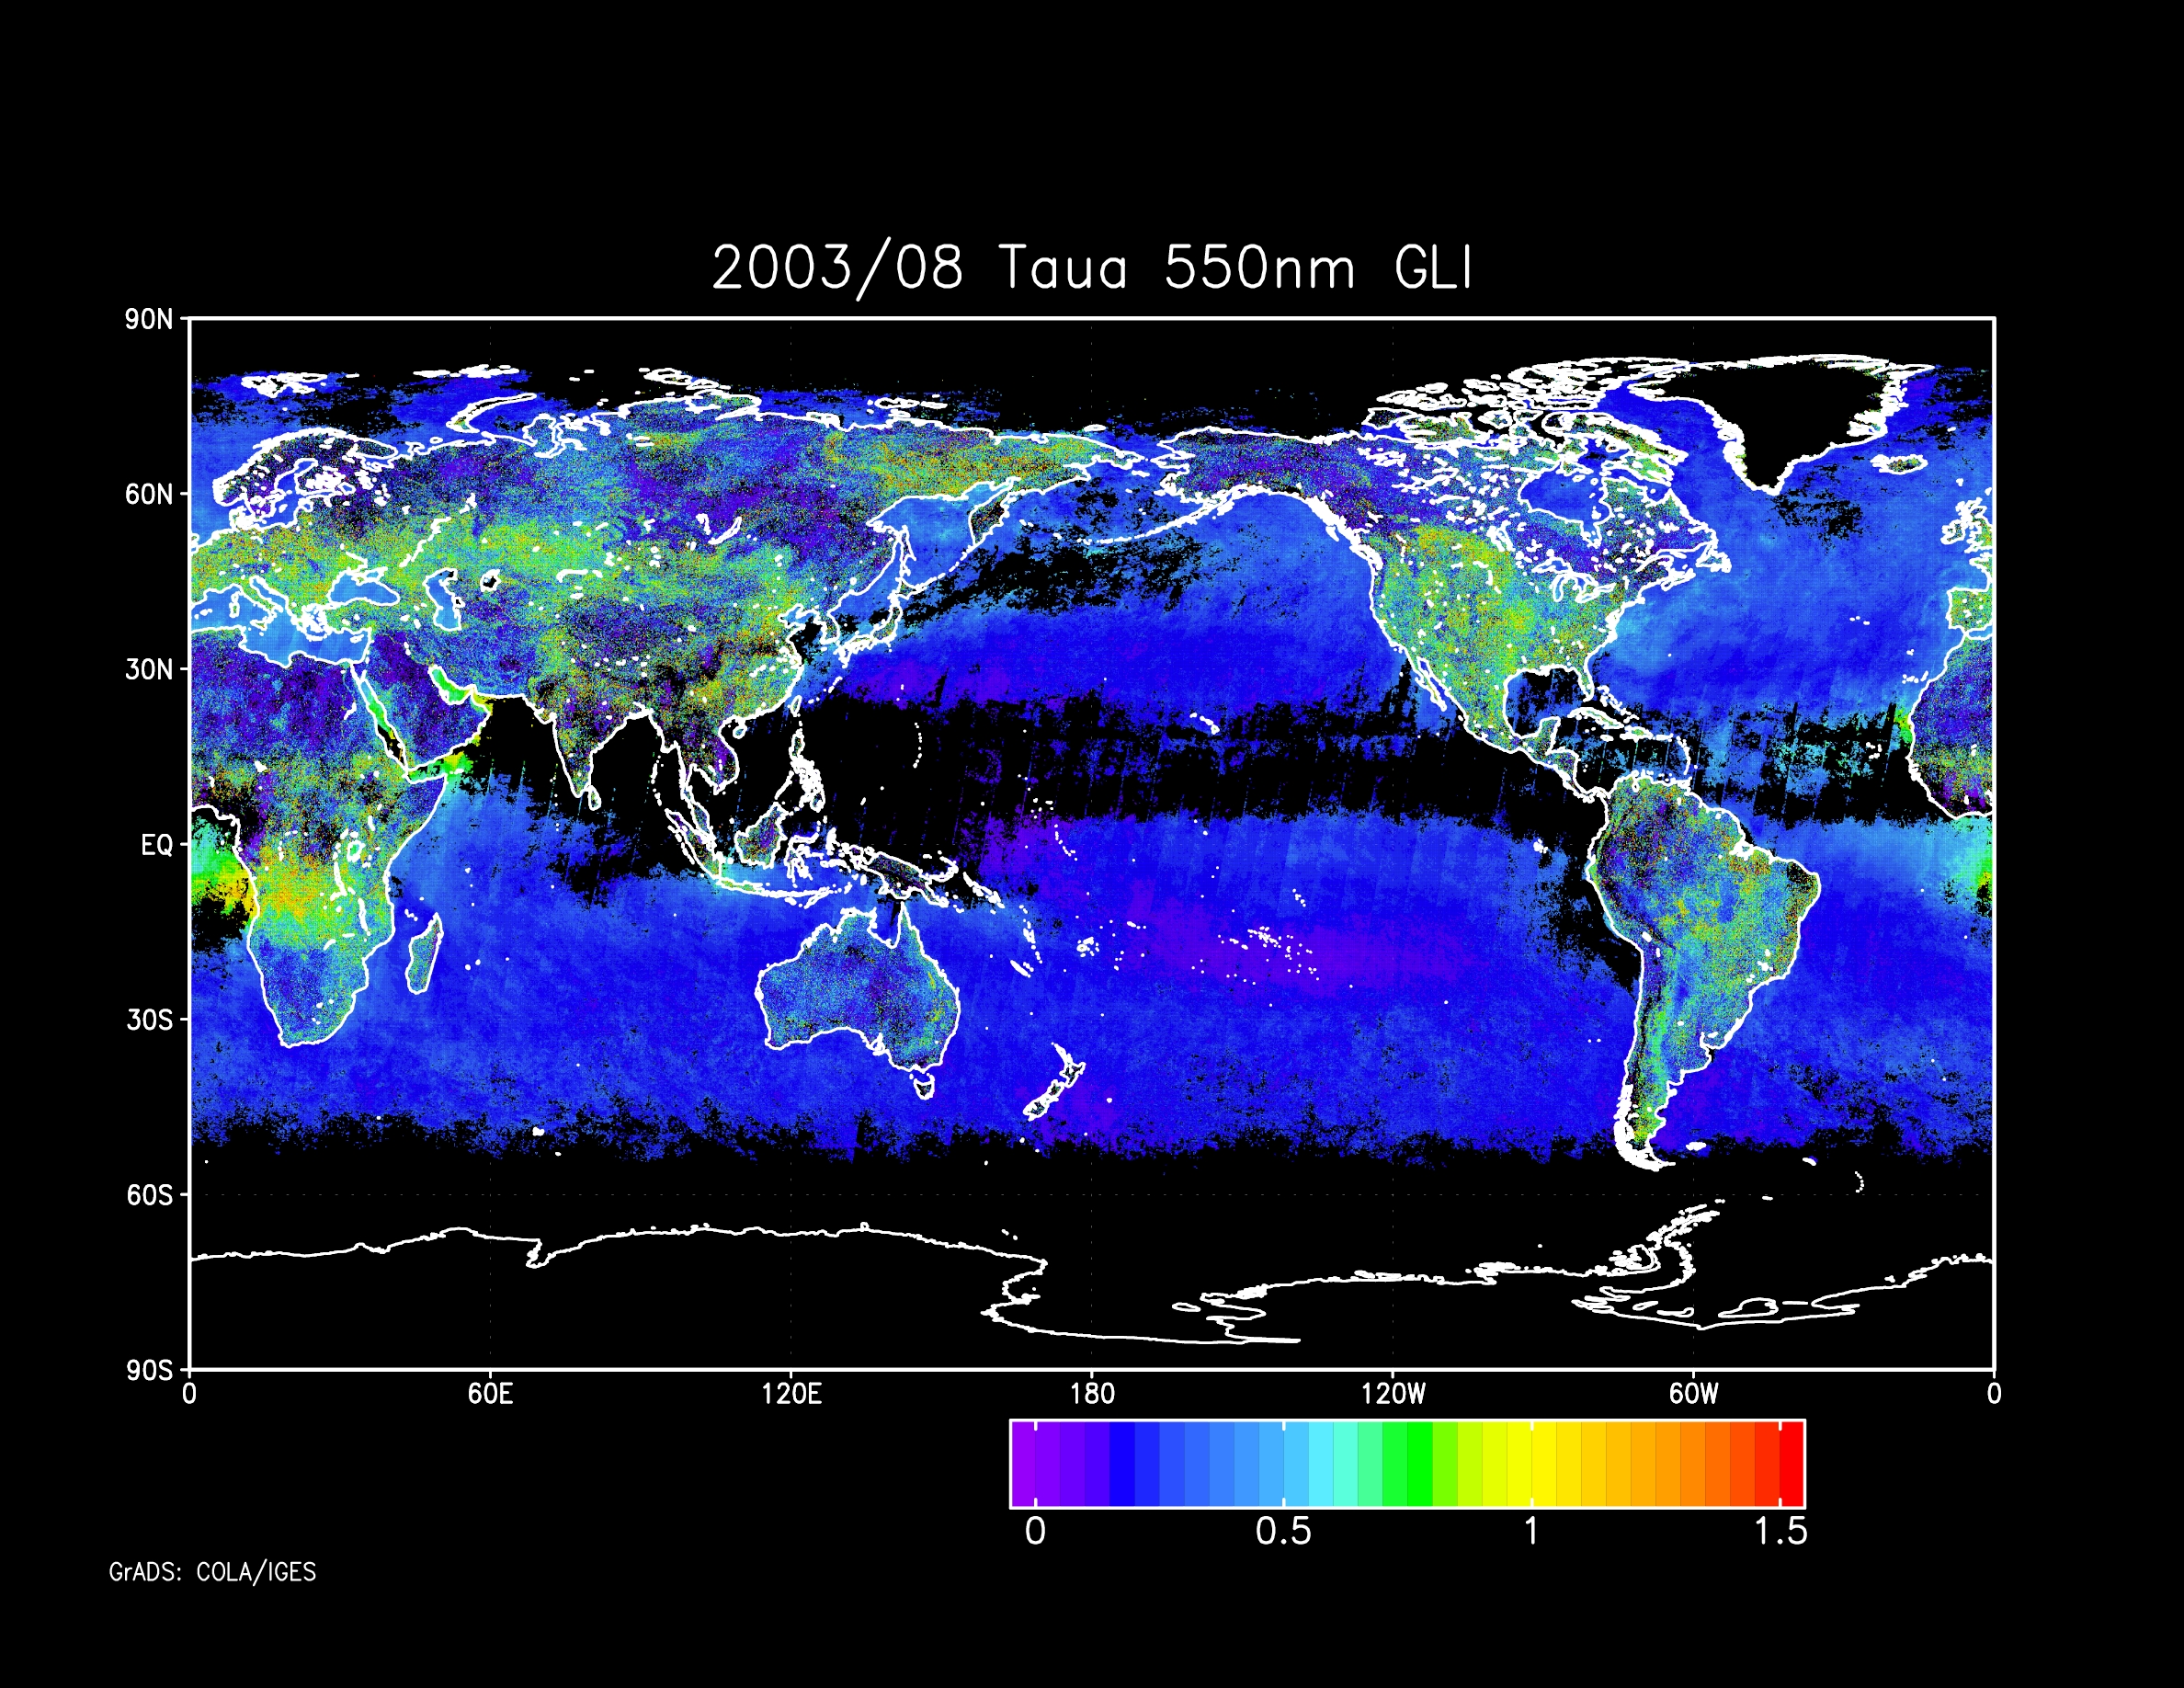
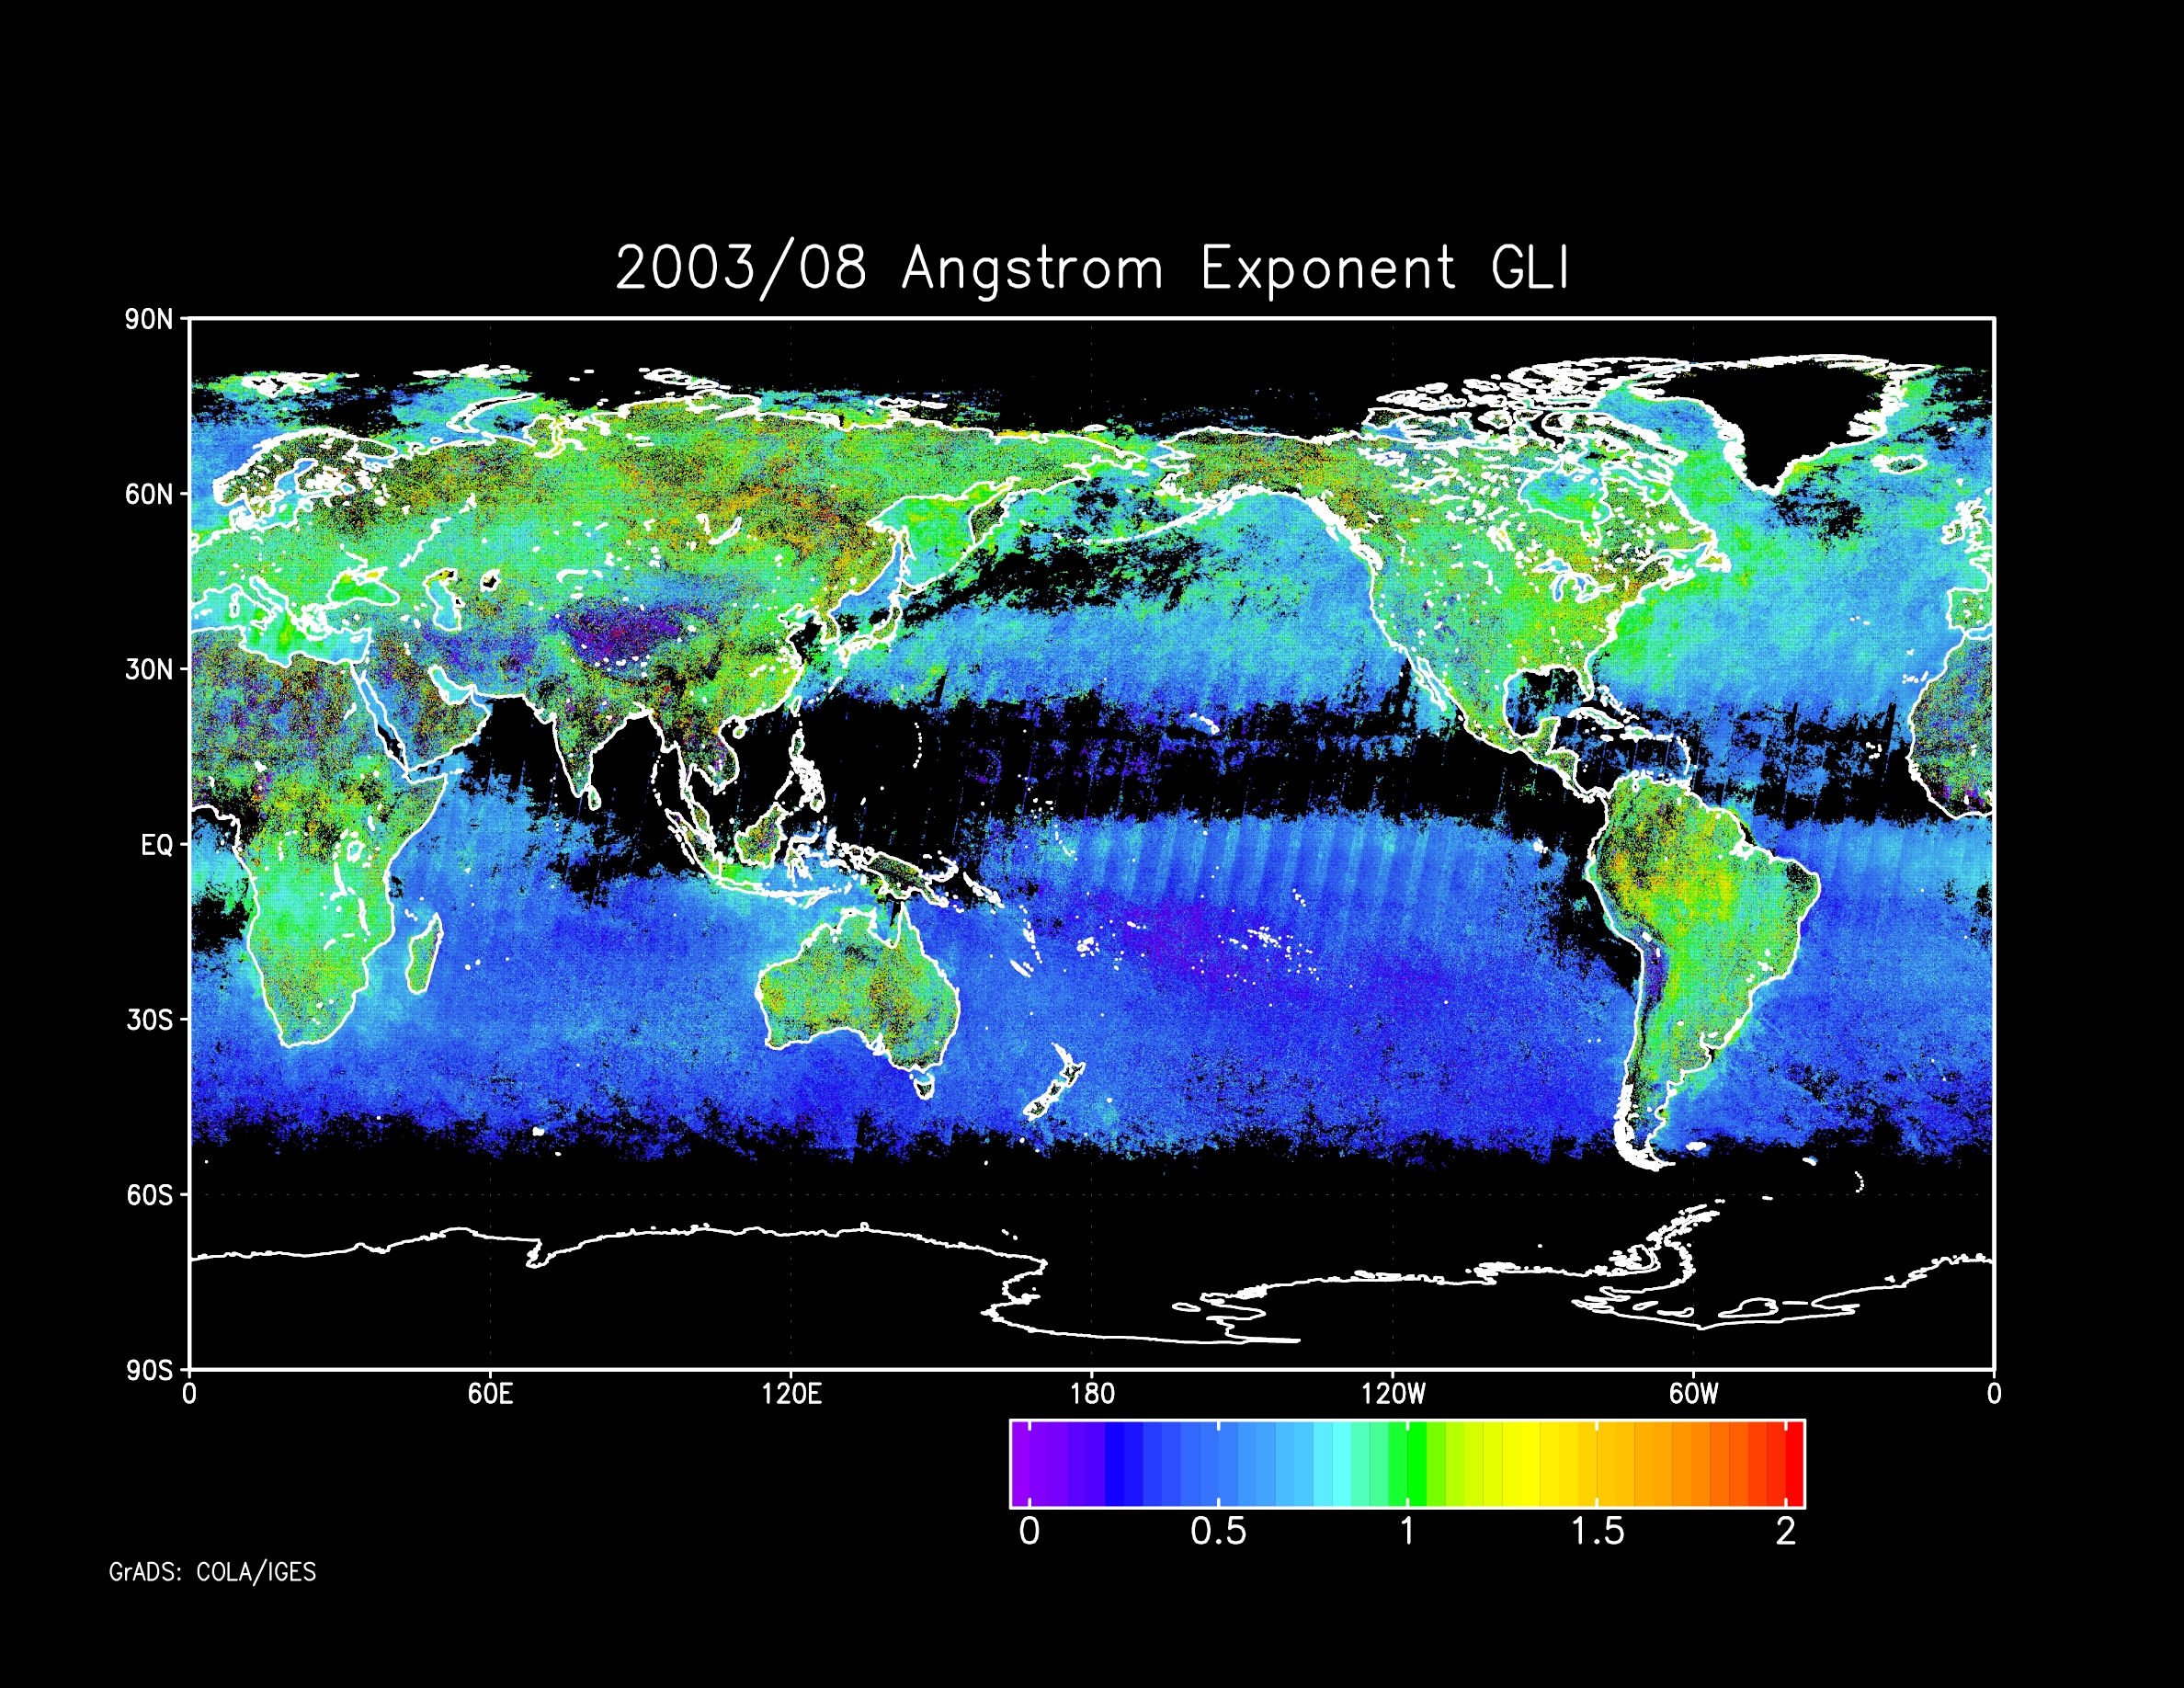
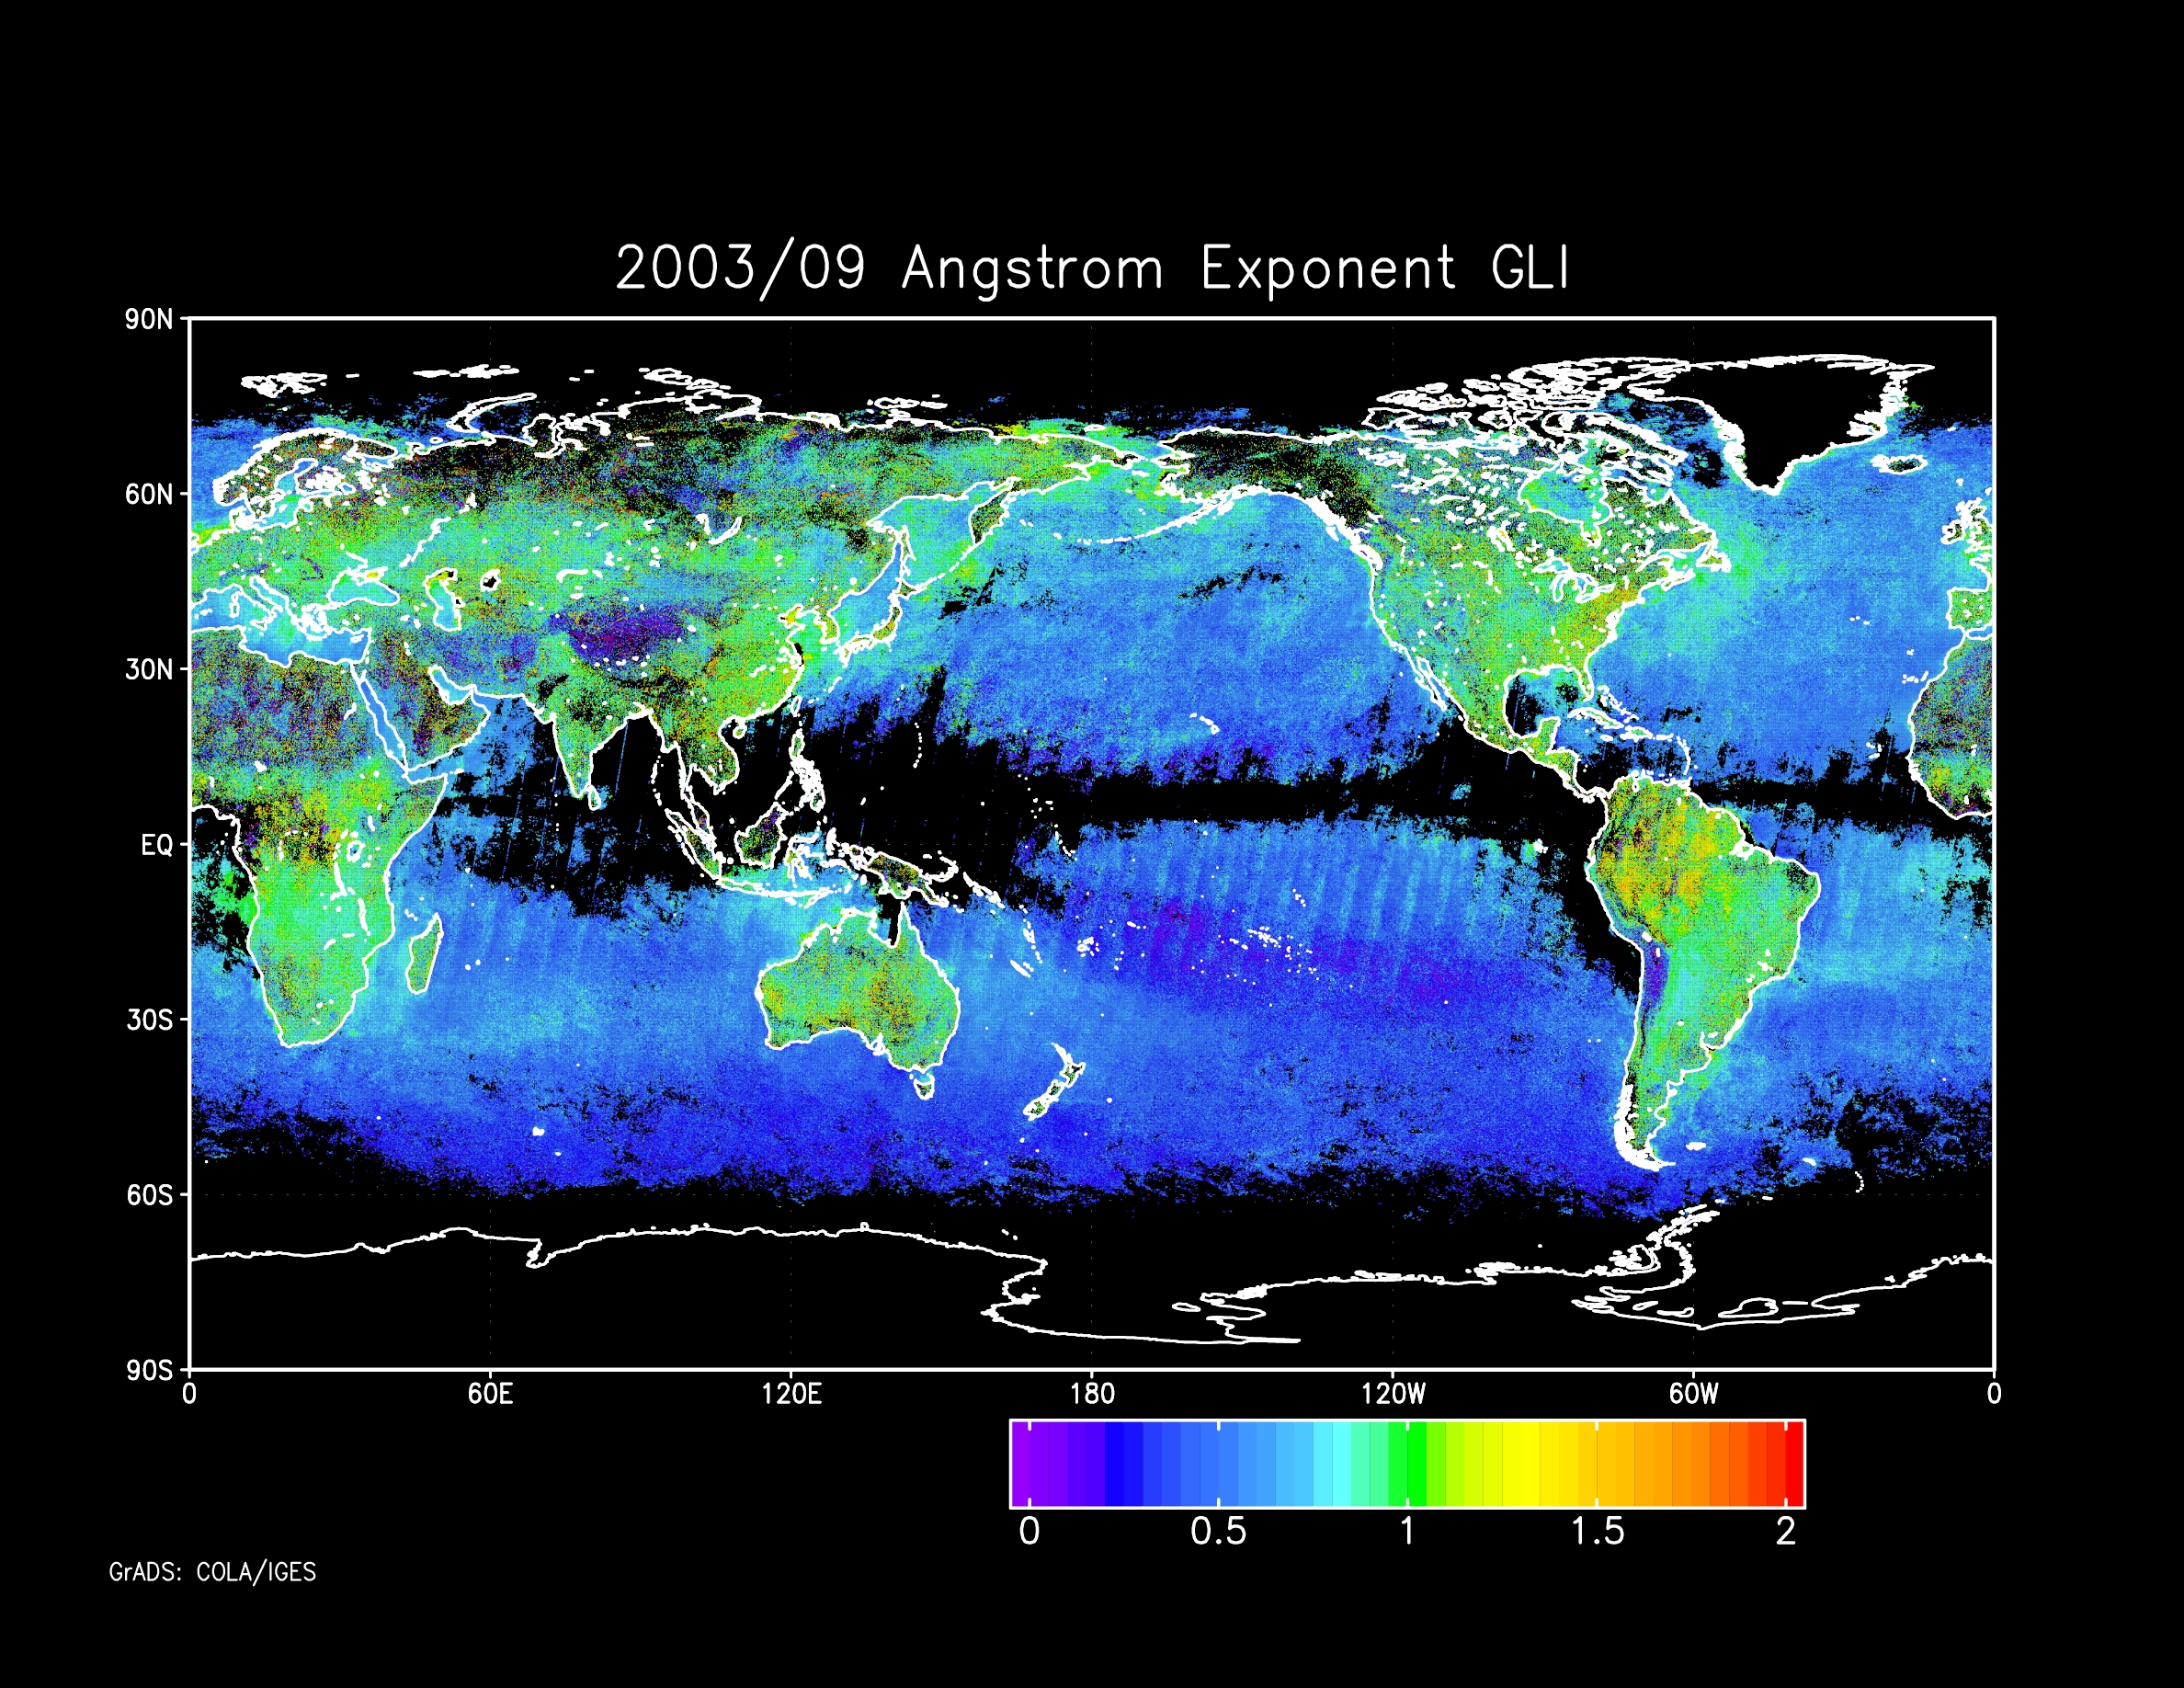
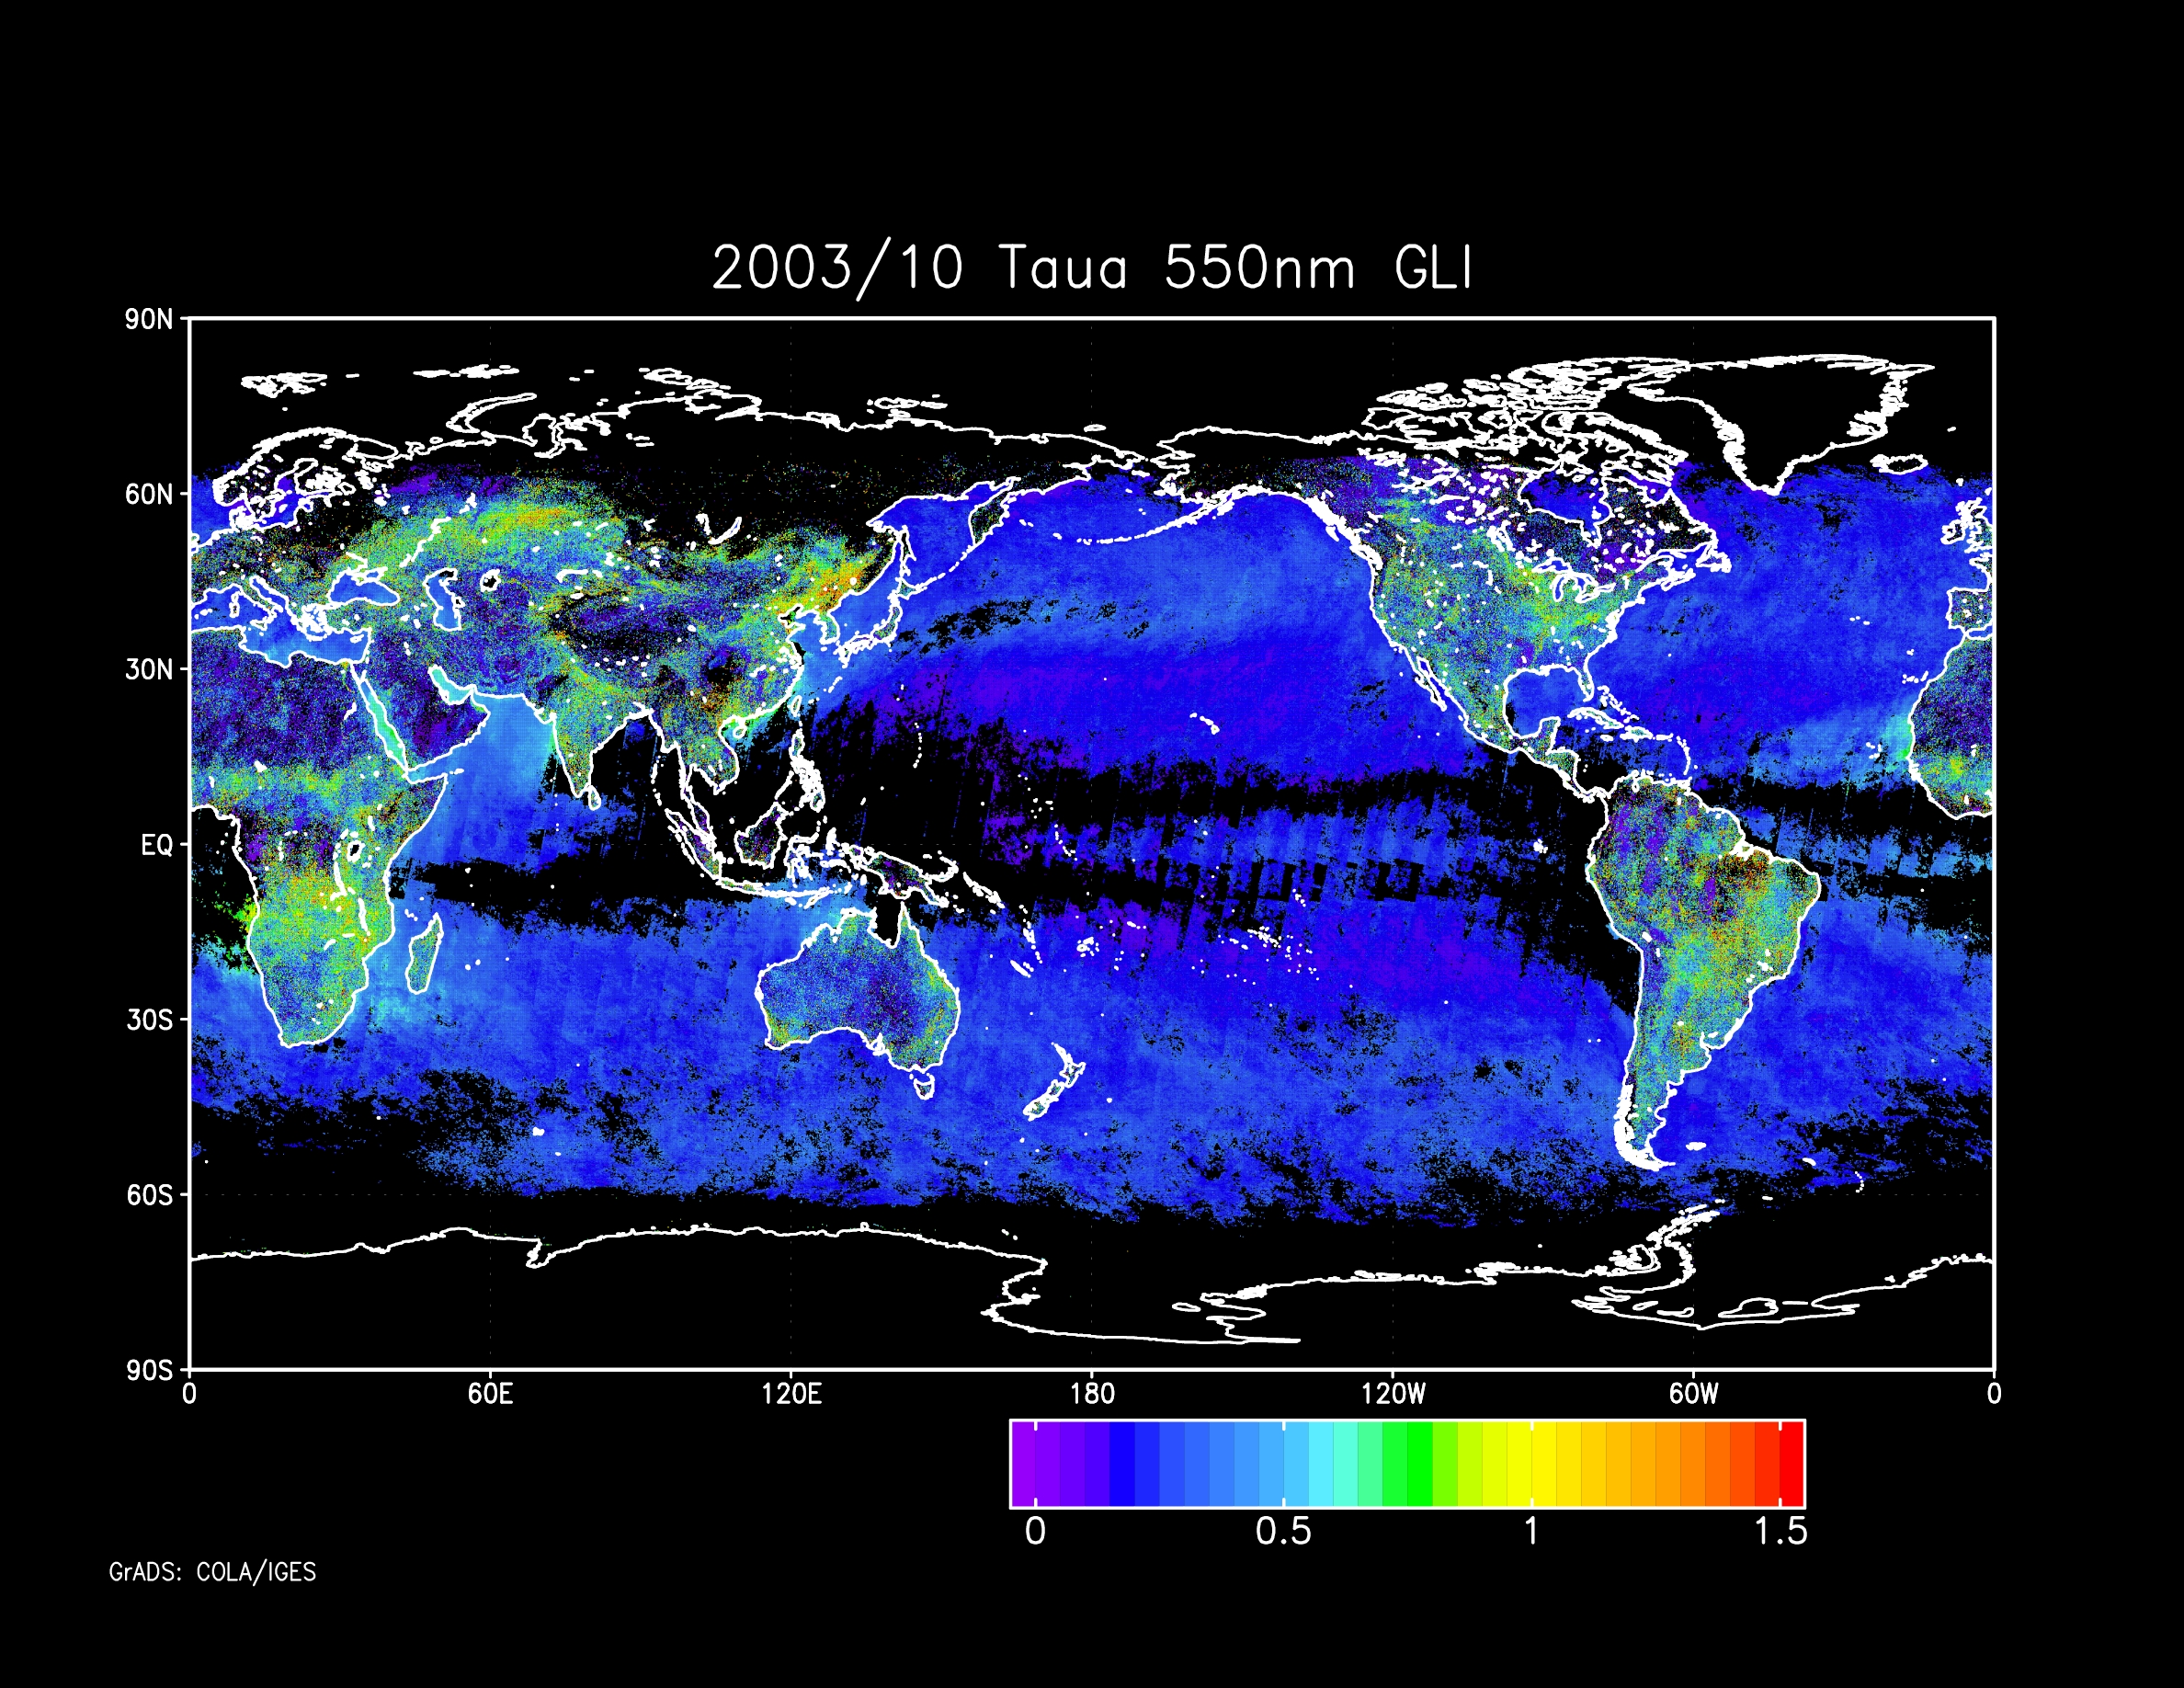
Monthly composite image
of land (MAP method) and ocean (Higurashi and Nakajima,
2002) aerosols
|
Tau-a (all) |
Angstrom exponent |
2003
Apr. |
 |
 |
2003
May. |
 |
 |
2003
Jun. |
 |
 |
2003
Jul. |
 |
 |
2003
Aug. |
 |
 |
2003
Sep. |
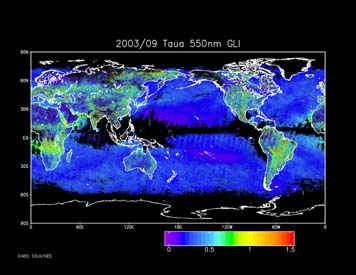 |
 |
2003
Oct. |
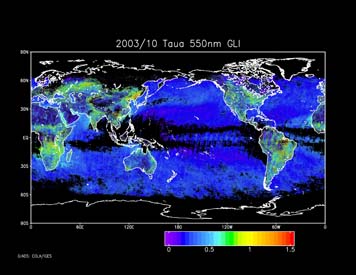 |
 |